

Trading
Explore a wide range of markets with competitive pricing, deep liquidity, and advanced trading tools.
Learn More 
Platform
Trade seamlessly with TMGM's powerful platform, built for speed, precision, and a superior trading experience.
Learn More Trading Platform
Academy
Learn the fundamentals of trading with beginner-friendly resources, including guides, webinars, and market insights.
Learn More News & Analysis
Get real-time market updates and expert analysis to stay ahead of trading opportunities
Learn More News & Analysis
About
Learn what sets TMGM apart — our global presence, regulatory strength, and commitment to innovation in trading.
Learn More Why Choose TMGM
Sponsorship
Chainlink Price Forecast: LINK trims gains after CCIP 2.0 launch, Swift ledger integration
- Chainlink is down over 4% on Tuesday, trading below $15.00 after a 10% jump the previous day.
- Chainlink released its new interoperability protocol amid an integration with the Swift ledger.
- Institutional demand for LINK holds firm with over $2 million in inflows on Monday.
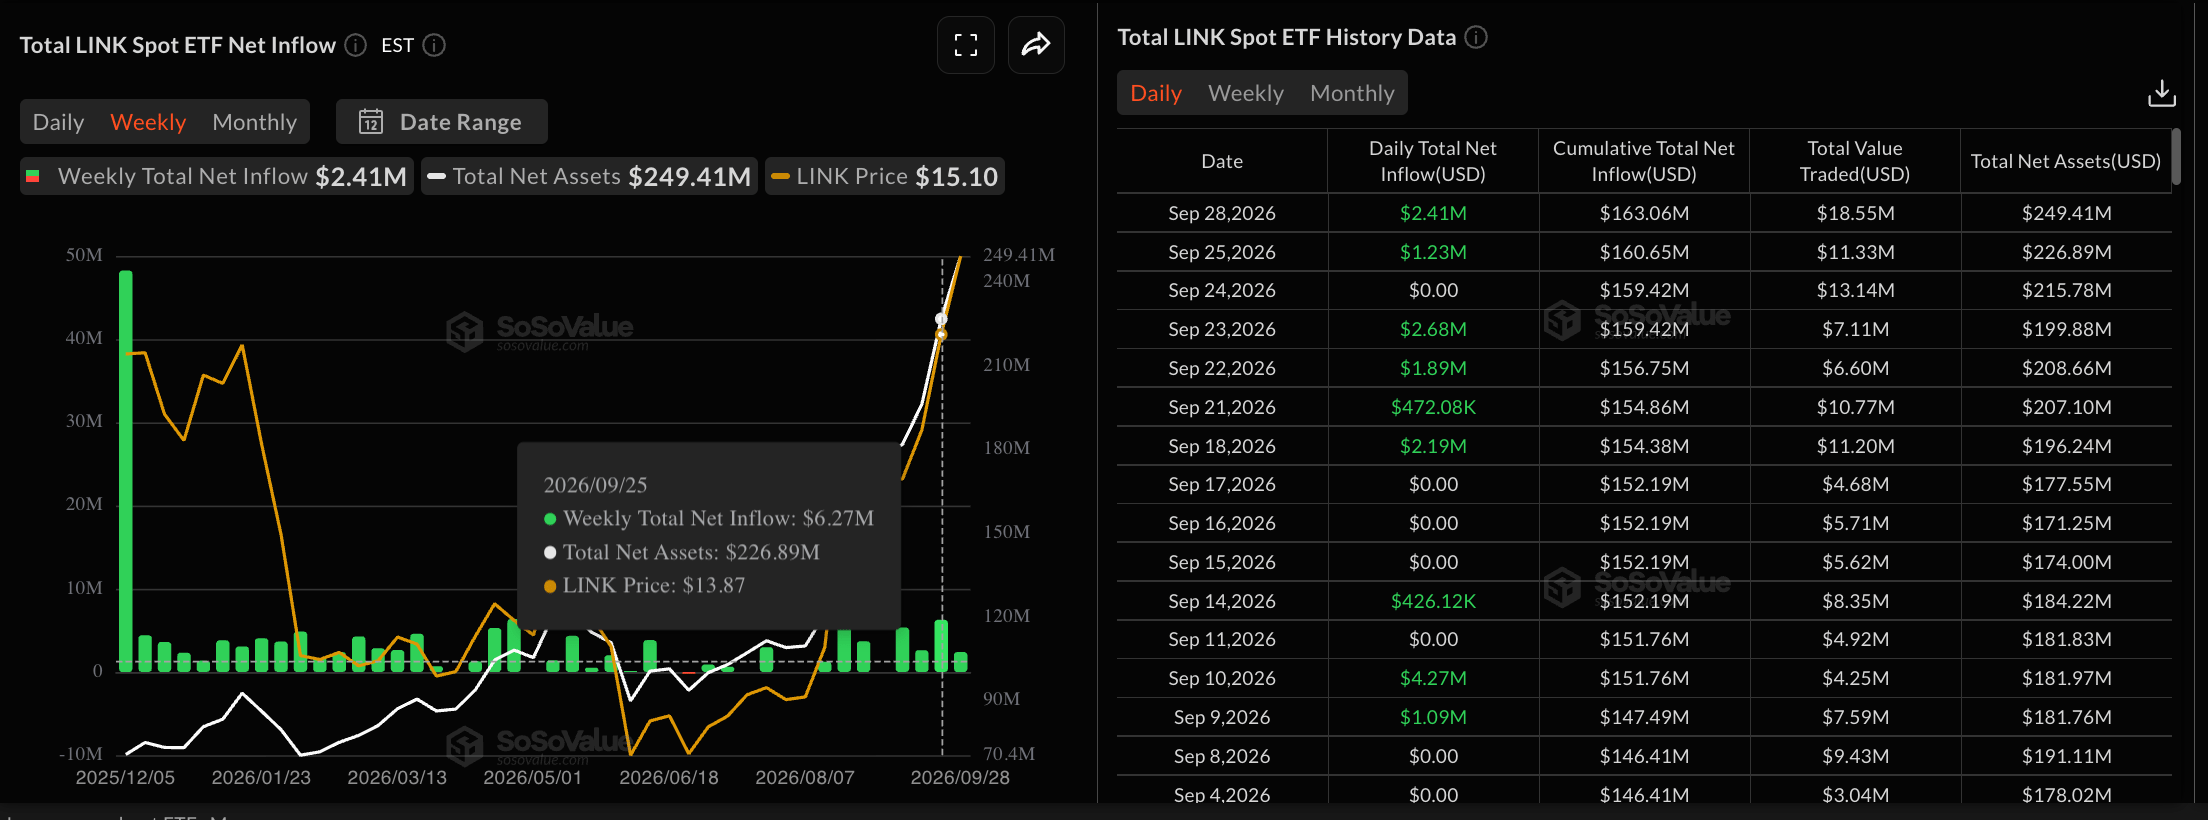
Chainlink (LINK) edges below $15.00 on Tuesday, trimming its 10% gains from the previous day, driven by the launch of its new Cross-Chain Interoperability Protocol (CCIP) 2.0 and Swift ledger integration for tokenized deposits and 24/7 cross-border payments. LINK-focused Exchange Traded Funds (ETFs) recorded over $2 million in inflows on Monday, following three consecutive weeks of inflows, suggesting strong institutional demand.

Chainlink must reclaim the $16.60 resistance set by the October 11 low to sustain an uptrend.
Chainlink connects banks to the SWIFT ledger and releases new CCIP 2.0
Chainlink released two major announcements at the Sibos 2026 event held by Swift on Monday. These announcements include the launch of CCIP 2.0 and its integration with Swift Ledger, enabling financial institutions to read and write access for tokenized deposits and to make 24/7 cross-border payments. The integration positions Chainlink as a bridge between traditional banks and on-chain payment services at a global scale.
This positioning helps Chainlink gain institutional demand as the broader crypto market shifts its attention toward tokenized assets. LINK-focused ETFs recorded $2.41 million in inflows, extending last week's $6.27 million. In addition, the net inflow over the last three weeks remains positive, reaffirming firm institutional interest in LINK.
Technical outlook: Chainlink trims gains as momentum stretches thin
Chainlink trades around $14.75 at press time on Tuesday, extending losses below $15.00 after earlier reaching a high of $15.77. LINK maintains a medium-term bullish bias, holding well above the 50-, 100-, and 200-day Exponential Moving Averages (EMAs) at $11.76, $10.70, and $10.44, respectively.
The rising EMAs suggest a firmly supportive broader trend, with the asset trading at fresh Year-To-Date (YTD) highs. The immediate resistance for LINK aligns with the October 11 low of $16.60, followed by the October 13 high of $20.19.
Momentum conditions reinforce this constructive bias, with the Relative Strength Index (RSI) at 66 hovering near the overbought threshold on the daily chart, while the Moving Average Convergence Divergence (MACD) remains positive, suggesting that buyers still control the near-term tone.
On the downside, initial technical support appears near the former November 3 low at $14.52, followed by the November 22 low at $11.74, with the 50-day EMA at $11.76 providing additional support.
(The technical analysis of this story was written with the help of an AI tool. Know more.)
POPULAR ARTICLES
1New Zealand Dollar declines to near 0.5650 despite RBNZ hike bets 2US Dollar Index Price Forecast: Likely revisit yearly high at around 101.803Australian Dollar: RBA hike reinforces hawkish stance – Deutsche Bank4Australian Dollar: RBA’s hawkish hike caps upside – Commerzbank5Chainlink Price Forecast: LINK trims gains after CCIP 2.0 launch, Swift ledger integration6Australian Dollar dips to fresh lows sub-0.7000 despite hawkish RBA Bullock7USD/JPY Price Forecast: Tests nine-day EMA support after falling below 157.508Dogecoin Price Forecast: DOGE tests key 200-day EMA support as bulls seek recovery9GBP/USD Price Forecast: Fresh downside leg likely below 1.3200
LIVE QUOTES


ALL ABOUT TECHNICAL
What Is the Dark Cloud Cover Pattern and How Do You Trade It?
What Is the Piercing Line Candlestick Pattern and How Do You Trade It?
What Are Tweezer Top and Bottom Candlestick Patterns?
Inside Bar Candlestick Pattern: What It Is, How to Identify It, and How to Trade It
Hanging Man Candlestick Pattern: How to Identify and Trade It
How to Draw Fibonacci Retracement: Mastering the Golden Ratio in Trading
What is MACD & How to Identify Entry & Exit Points
What is the Relative Strength Index (RSI)
What is Scalping in Trading & How Does It Work
Get Started!
Sign up and access the Global Markets in less than 3 minutes

Connect With Us












The information provided on this website is of a general nature only and does not constitute personal financial advice. Before acting on any information on this website, you should consider the suitability of the information in relation to your objectives, financial situation and needs. Investing in CFDs and FX Margin Contracts carries significant risks and is not suitable for all investors. You may lose more than your initial deposit. You do not own, or have, any interest in the underlying asset. We recommend that you seek independent advice and ensure you fully understand the risks involved before trading. It is important that you read and consider the disclosure document before you acquire any product listed on the website. The information and advertisements offered on this website are not intended for use by any person in any country or jurisdiction where such use would be contrary to local laws and regulations. The Products and Services offered on this website are not intended for residents of the United States, Malaysia and Thailand.
TMGM is authorized and regulated in various jurisdictions.
Trademax Australia Limited, trading as TMGM, is regulated by the Australian Securities and Investments Commission (ASIC), AFSL no. 436416 and is located at Level 28, One International Tower, 100 Barangaroo Avenue, 2000 Sydney, NSW Australia.
Email: [email protected]
Trademax Global Limited, trading as TMGM, is authorized and regulated by the Vanuatu Financial Services Commission (VFSC), registration number 40356 and registered at 1276, Kumul Highway, Port Vila, Vanuatu, Republic of Vanuatu.
Email: [email protected]
Trademax Global Markets (SE) Limited, trading as TMGM, is authorized and regulated by the Financial Services Authority (FSA) of Seychelles, with license number SD224. The company is registered at Office No 13, Providence Estate ABIS Centre, Mahe, Seychelles.
Email: [email protected]
Trademax Global Markets (International) Pty Ltd, trading as TMGM, is authorized and regulated by the Financial Services Commission, Mauritius (FSC) with license no. GB22201012, and registered at 33, Edith Cavell Street C/o IQ EQ Fund Services (Mauritius) Ltd Port Louis, 11324 Mauritius.
Email: [email protected]
Copyright © TMGM. All rights reserved