

Trading
Explore a wide range of markets with competitive pricing, deep liquidity, and advanced trading tools.
Learn More 
Platform
Trade seamlessly with TMGM's powerful platform, built for speed, precision, and a superior trading experience.
Learn More Trading Platform
Academy
Learn the fundamentals of trading with beginner-friendly resources, including guides, webinars, and market insights.
Learn More News & Analysis
Get real-time market updates and expert analysis to stay ahead of trading opportunities
Learn More News & Analysis
About
Learn what sets TMGM apart — our global presence, regulatory strength, and commitment to innovation in trading.
Learn More Why Choose TMGM
Sponsorship
Why centralised exchanges are taking RWA market share from Hyperliquid
- 26% is Hyperliquid’s remaining share of the RWA perpetual futures market. That is down from 80% in July, with centralised exchanges capturing 64% of trading volume.
- 30% was Binance’s RWA market share after a rise from 3% in two weeks. OKX’s share reached 14% as competition broadened.
- The 100-day EMA provided a rebound point for HYPE, just above support at $75.6.
Centralised exchanges (CEXs) are taking real-world asset (RWA) perpetual futures market share from Hyperliquid (HYPE). The shift is unfolding against pressure across the broader financial market.

26% is the share of RWA perpetual trading volume now held by Hyperliquid’s trade.xyz. It accounted for roughly 80% in July, according to Artemis data shared by Ark Invest Digital Asset Head of Research Lorenzo Valente. Centralised exchanges now command a combined 64% of the market. Weekly trading volume has increased twofold to threefold, rising from around $20 billion to a range of $40 billion to $60 billion.
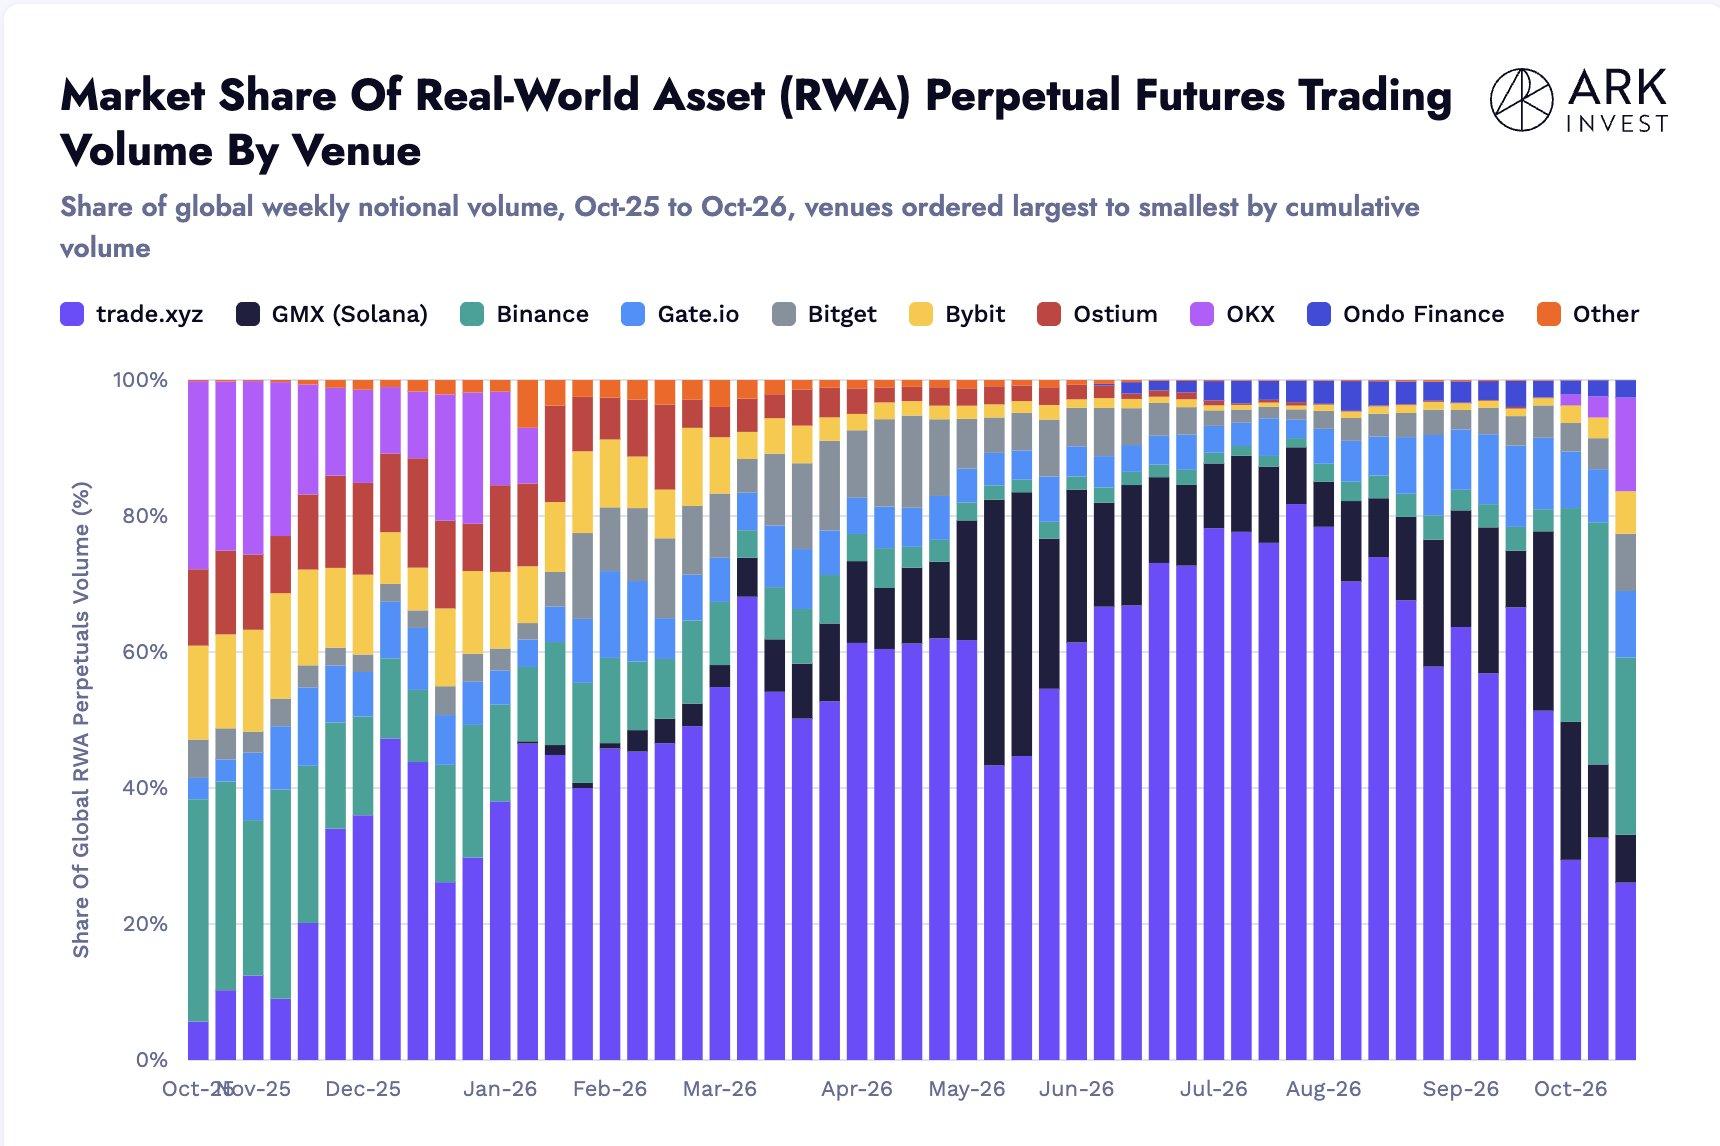
Rather than merely drawing existing volume away from other venues, centralised exchanges appear to be attracting most of the market’s incremental trading activity, the figures suggest.
CEX expansion in RWA perpetuals erodes Hyperliquid’s share
30% was Binance’s reported market share after a jump from 3% in just two weeks. Over that period, OKX’s share rose to 14%. Gate and Bitget are building their presence as well.
By adding traditional asset exposure to established crypto trading products, centralised exchanges have been able to drive this growth.
Access to assets around the clock gave Hyperliquid an early advantage, as conventional markets restrict trading in those assets to set hours.
At the start of the year, geopolitical tensions made oil perpetual futures particularly appealing to traders seeking to react outside conventional market hours. As one of the few venues providing continuous oil trading, Hyperliquid attracted participants beyond its core crypto-native audience.
That initial edge is now narrowing as centralised exchanges introduce comparable access to traditional assets.
In March, Binance introduced TradFi perpetual contracts with USDT settlement and round-the-clock trading. The range covers commodities including gold and silver, selected shares such as Tesla and Intel, and exchange-traded funds (ETFs).
More than 40 tokenised US stocks and ETFs became available on OKX in July, with 24/7 trading against USDT in supported regions. Through its unified markets, users can access assets including Apple, Nvidia and Tesla using their existing exchange accounts.
Traditional financial institutions are also advancing into tokenised securities as this competitive landscape changes. In January, the NYSE outlined plans for a platform enabling 24/7 trading and blockchain-based settlement of tokenised securities, subject to regulatory approval.
Subsequently, OKX and NYSE parent Intercontinental Exchange (ICE) set out plans to establish an on-chain tokenised securities venue through their joint venture, OKXICE.
In September, the US Securities and Exchange Commission (SEC) introduced its Innovation Exemption. This provides conditional, temporary regulatory relief for qualifying venues that trade certain tokenised US-listed stocks.
$208.07 billion was Hyperliquid’s total perpetual futures volume over 30 days. The platform remains a major venue for perpetual futures despite its declining RWA market share.
$75.6 support holds: HYPE technical outlook above the 100-day EMA
$77.8 is HYPE’s price on the daily chart at the time of writing, representing a 3.8% decline over the past 24 hours. After rebounding from the 100-day Exponential Moving Average (EMA) near $76, the token remains below the 20-day and 50-day EMAs, which are grouped just above $82.00. This leaves the near-term bias bearish.
Weak momentum readings reinforce the continuing downside pressure despite a modest recovery from recent lows. The 14-day Relative Strength Index (RSI) stands at 41, while the Stochastic Oscillator (Stoch) is near 17.
The 100-day EMA offers immediate downside support just above the horizontal level at $75.69. Below that, further support lies at $67.64, followed by $61.16.
$82.10 marks the first upside resistance, where the short-term EMAs converge. A stronger barrier follows at $85.04. Sustained gains above that zone would clear a path towards the major resistance identified at $97.84.
(The technical analysis of this story was written with the help of an AI tool. Learn more.)
POPULAR ARTICLES
1Japanese Yen retreats from one-month top vs recovering USD as focus remains on Fed and BoJ2Shifting safe-haven demand lifts Indonesian Rupiah against US Dollar3Gold price today: India records a decline, FXStreet data show4Near 110.00: AUD/JPY weakens as price forecast remains bearish below 100-day SMA5Above 0.7000: Australian Dollar stays near monthly high as USD recovers63 Top Price Predictions: Bitcoin, Ethereum, Ripple – Major support levels contain recent sell-off as BTC, ETH and XRP recover7US Dollar pares recent losses, nudging Swiss Franc lower8Why centralised exchanges are taking RWA market share from Hyperliquid9Cardano Price Forecast: ADA correction intensifies amid whale selling
LIVE QUOTES


ALL ABOUT TECHNICAL
What Is the Dark Cloud Cover Pattern and How Do You Trade It?
What Is the Piercing Line Candlestick Pattern and How Do You Trade It?
What Are Tweezer Top and Bottom Candlestick Patterns?
Inside Bar Candlestick Pattern: What It Is, How to Identify It, and How to Trade It
Hanging Man Candlestick Pattern: How to Identify and Trade It
How to Draw Fibonacci Retracement: Mastering the Golden Ratio in Trading
What is the Relative Strength Index (RSI)
What is Scalping in Trading & How Does It Work
Get Started!
Sign up and access the Global Markets in less than 3 minutes

Connect With Us












The information provided on this website is of a general nature only and does not constitute personal financial advice. Before acting on any information on this website, you should consider the suitability of the information in relation to your objectives, financial situation and needs. Investing in CFDs and FX Margin Contracts carries significant risks and is not suitable for all investors. You may lose more than your initial deposit. You do not own, or have, any interest in the underlying asset. We recommend that you seek independent advice and ensure you fully understand the risks involved before trading. It is important that you read and consider the disclosure document before you acquire any product listed on the website. The information and advertisements offered on this website are not intended for use by any person in any country or jurisdiction where such use would be contrary to local laws and regulations. The Products and Services offered on this website are not intended for residents of the United States, Malaysia and Thailand.
TMGM is authorized and regulated in various jurisdictions.
Trademax Australia Limited, trading as TMGM, is regulated by the Australian Securities and Investments Commission (ASIC), AFSL no. 436416 and is located at Level 28, One International Tower, 100 Barangaroo Avenue, 2000 Sydney, NSW Australia.
Email: [email protected]
Trademax Global Limited, trading as TMGM, is authorized and regulated by the Vanuatu Financial Services Commission (VFSC), registration number 40356 and registered at 1276, Kumul Highway, Port Vila, Vanuatu, Republic of Vanuatu.
Email: [email protected]
Trademax Global Markets (SE) Limited, trading as TMGM, is authorized and regulated by the Financial Services Authority (FSA) of Seychelles, with license number SD224. The company is registered at Office No 13, Providence Estate ABIS Centre, Mahe, Seychelles.
Email: [email protected]
Trademax Global Markets (International) Pty Ltd, trading as TMGM, is authorized and regulated by the Financial Services Commission, Mauritius (FSC) with license no. GB22201012, and registered at 33, Edith Cavell Street C/o IQ EQ Fund Services (Mauritius) Ltd Port Louis, 11324 Mauritius.
Email: [email protected]
Copyright © TMGM. All rights reserved