

Trading
Explore a wide range of markets with competitive pricing, deep liquidity, and advanced trading tools.
Learn More 
Platform
Trade seamlessly with TMGM's powerful platform, built for speed, precision, and a superior trading experience.
Learn More Trading Platform
Academy
Learn the fundamentals of trading with beginner-friendly resources, including guides, webinars, and market insights.
Learn More News & Analysis
Get real-time market updates and expert analysis to stay ahead of trading opportunities
Learn More News & Analysis
About
Learn what sets TMGM apart — our global presence, regulatory strength, and commitment to innovation in trading.
Learn More Why Choose TMGM
Sponsorship
$1,698 Peak in Focus: Zcash Price Forecast as ZEC Stages Bullish Reversal on NU7 Upgrade
- $1,250 remains below Zcash’s trading level on Wednesday. The previous day’s 9% jump points to a bullish reversal.
- Over $1 million flowed into the Zcash ETF on Tuesday. Following Monday’s $10 million outflow, the inflows suggest selling pressure has eased.
- November 6 is the scheduled date for Zcash’s final NU7 mainnet activation, which will cut block confirmation time to 25 seconds.
$1,200 remains below Zcash (ZEC) on Wednesday. Signs of a bullish recovery follow the previous day’s 9% rebound, linked to the forthcoming NU7 upgrade. A report for Zcash holders published by Blockworks on Tuesday highlighted steady network growth. ZEC’s technical outlook remains bullish, with buyers targeting a further advance towards $1,698.
November 6 NU7 upgrade approaches as institutional selling eases
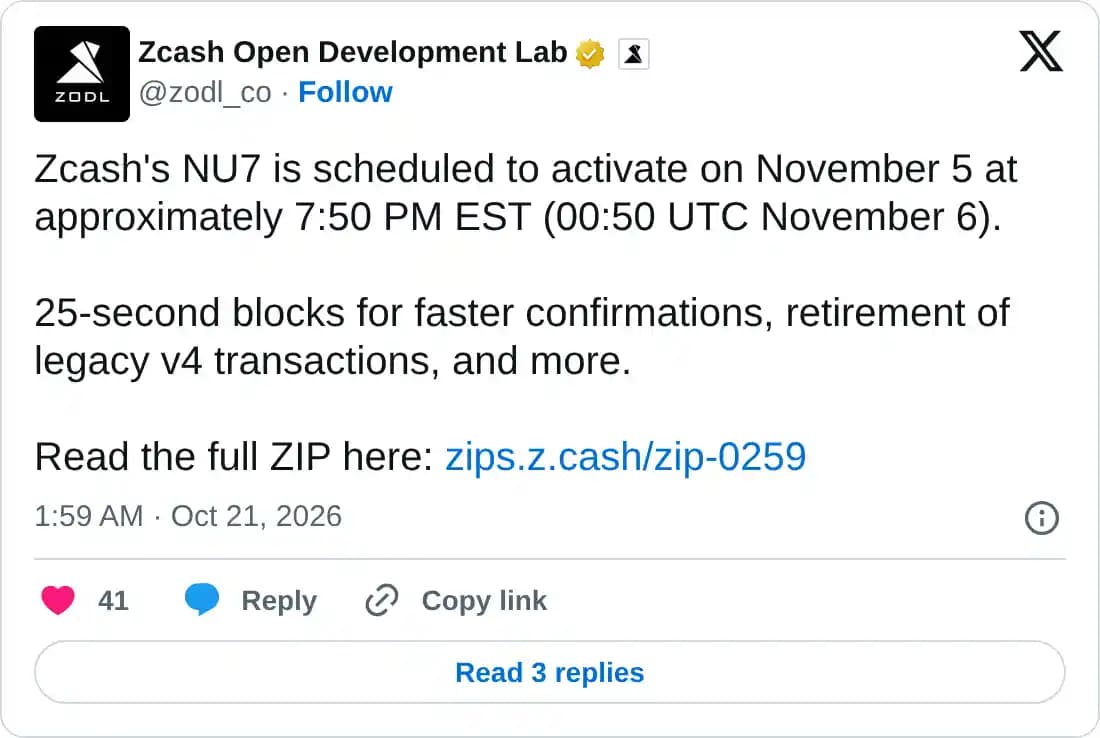
November 6 at 00:50 GMT is the scheduled time for the final mainnet activation of NU7, following the decision announced by Zcash Open Development Lab. The upgrade will shorten block confirmation time from 75 seconds to 25 seconds, improving transaction speed by 3x. It will also retire the legacy v4 transaction pool, suspending the ZEC tokens held in the Sprout shielded pool. A new Network Sustainability Mechanism (NSM) will allocate 60% of fees to the NSM Value Balance, with the remainder going to miners.
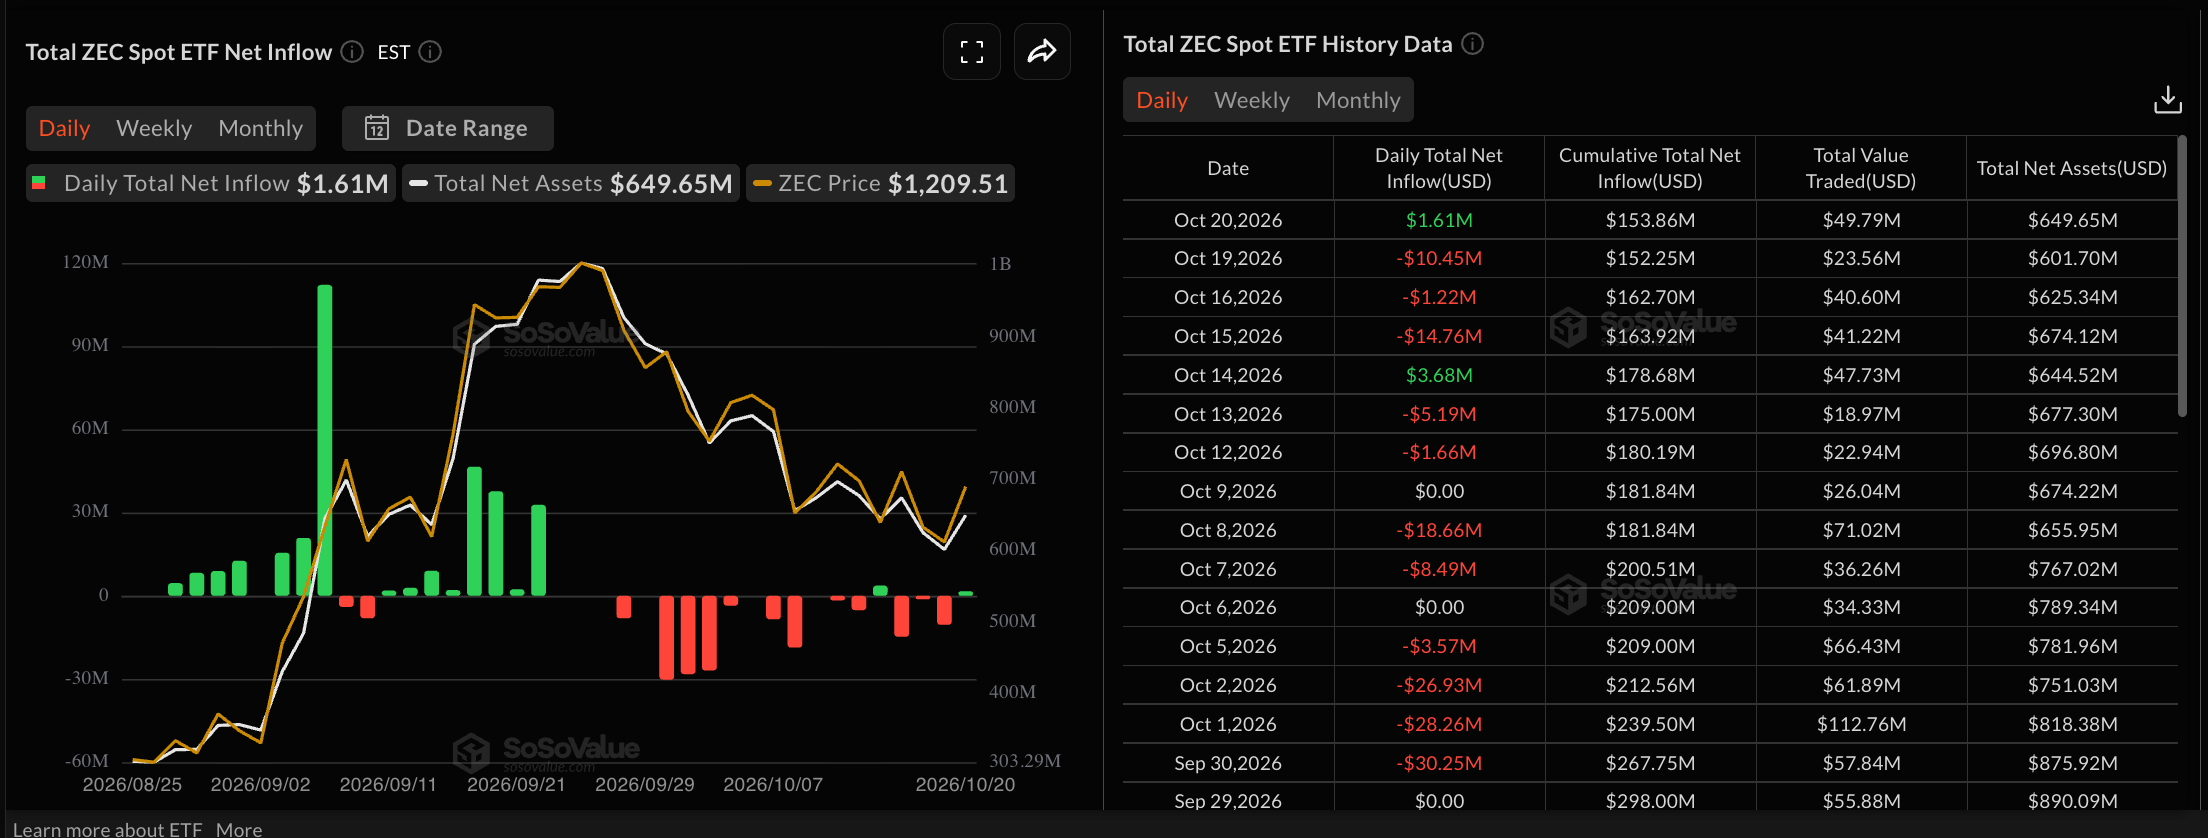
After three consecutive weeks of heavy selling, institutional investors remain under pressure. However, SoSoValue figures show that Bitwise’s ZEC-focused exchange-traded fund (ETF) attracted $1.61 million on Tuesday, signalling a positive near-term shift from Monday’s $10.45 million in outflows. Total weekly outflows have fallen sharply, from $93.56 million in early October to $19.15 million last week. The trend suggests institutional investors are reducing their selling pressure.
Network activity, meanwhile, has strengthened. Blockworks figures show transactions increased 21% over the last three months to roughly 710,000, with non-shielded transactions accounting for over half. The network’s Real Economic Value (REV) also increased by almost 85% to $204,000.
$1,700 in focus: Zcash’s technical rally outlook
$1,260 is Zcash’s price at press time on Wednesday, with the near-term bias remaining bullish. The four-hour chart places ZEC above its 50- and 200-period Exponential Moving Averages (EMAs), at $1,181 and $1,230 respectively.
The previous day’s 9% recovery took Zcash through its descending resistance trendline. Now providing support around $1,183, that line reinforces the bullish price structure. The next test is the $1,296 horizontal level established by the September 9 high. A confirmed break above it could carry the rally towards the September 26 peak of $1,698.
Buying pressure appears sustained rather than exhausted: the four-hour Relative Strength Index (RSI) stands near 65, and the Moving Average Convergence Divergence (MACD) line maintains a positive upward trajectory.
If prices fall, the first support level is the 200-period EMA at $1,230. Below that lies a structural support zone combining the former resistance trendline breakout near $1,183 and the 50-period EMA at $1,181.
(The technical analysis of this story was written with the help of an AI tool. Know more.)
POPULAR ARTICLES
1UK CPI data boosts expectations of imminent BoE rate hike as Euro falls against British Pound20.8200 Area: Focus on Swiss Franc Gains Against US Dollar – UOB3BI holds benchmark rate steady; Indonesian Rupiah weakens4British Pound: BoE outlook becomes more complex as inflation rises - Deutsche Bank51.4030 Area: USD/CAD Price Forecast as bears await a break below 50% Fibo. support6Forex Today: Hot inflation gives British Pound little support7Equities: AI cycle doubts prompt defensive shift – Danske Bank8Above-forecast UK inflation and higher public debt leave British Pound wavering9US Dollar: Looming Fed pause limits scope for near-term gains – Commerzbank
LIVE QUOTES


ALL ABOUT TECHNICAL
What Is the Dark Cloud Cover Pattern and How Do You Trade It?
What Is the Piercing Line Candlestick Pattern and How Do You Trade It?
What Are Tweezer Top and Bottom Candlestick Patterns?
Inside Bar Candlestick Pattern: What It Is, How to Identify It, and How to Trade It
Hanging Man Candlestick Pattern: How to Identify and Trade It
How to Draw Fibonacci Retracement: Mastering the Golden Ratio in Trading
What is the Relative Strength Index (RSI)
What is Scalping in Trading & How Does It Work
Get Started!
Sign up and access the Global Markets in less than 3 minutes

Connect With Us












The information provided on this website is of a general nature only and does not constitute personal financial advice. Before acting on any information on this website, you should consider the suitability of the information in relation to your objectives, financial situation and needs. Investing in CFDs and FX Margin Contracts carries significant risks and is not suitable for all investors. You may lose more than your initial deposit. You do not own, or have, any interest in the underlying asset. We recommend that you seek independent advice and ensure you fully understand the risks involved before trading. It is important that you read and consider the disclosure document before you acquire any product listed on the website. The information and advertisements offered on this website are not intended for use by any person in any country or jurisdiction where such use would be contrary to local laws and regulations. The Products and Services offered on this website are not intended for residents of the United States, Malaysia and Thailand.
TMGM is authorized and regulated in various jurisdictions.
Trademax Australia Limited, trading as TMGM, is regulated by the Australian Securities and Investments Commission (ASIC), AFSL no. 436416 and is located at Level 28, One International Tower, 100 Barangaroo Avenue, 2000 Sydney, NSW Australia.
Email: [email protected]
Trademax Global Limited, trading as TMGM, is authorized and regulated by the Vanuatu Financial Services Commission (VFSC), registration number 40356 and registered at 1276, Kumul Highway, Port Vila, Vanuatu, Republic of Vanuatu.
Email: [email protected]
Trademax Global Markets (SE) Limited, trading as TMGM, is authorized and regulated by the Financial Services Authority (FSA) of Seychelles, with license number SD224. The company is registered at Office No 13, Providence Estate ABIS Centre, Mahe, Seychelles.
Email: [email protected]
Trademax Global Markets (International) Pty Ltd, trading as TMGM, is authorized and regulated by the Financial Services Commission, Mauritius (FSC) with license no. GB22201012, and registered at 33, Edith Cavell Street C/o IQ EQ Fund Services (Mauritius) Ltd Port Louis, 11324 Mauritius.
Email: [email protected]
Copyright © TMGM. All rights reserved