Article

Marubozu Candle: Types of Marubozu Candlestick Patterns

Direct Answer: A Marubozu candlestick is a single candle with a long body and no, or almost no, wicks, showing buyers or sellers controlled the session from open to close. The two main types are bullish Marubozu and bearish Marubozu, with three variations: Full Marubozu, Marubozu Open, and Marubozu Close. Traders use it as a momentum signal for technical analysis when trading breakouts and trend continuation, strongest with trend alignment and key level context.


Key Takeaways


  • A Marubozu candle is a long bodied candlestick with minimal or no wicks, showing one sided control.

  • The two main types are bullish Marubozu and bearish Marubozu.

  • Common variations are Full Marubozu, Marubozu Open, and Marubozu Close.

  • Higher quality signals align with trend and support and resistance.

  • Marubozu candles are most used for breakouts and trend continuation, while reversal reads need stricter confirmation.


What Is a Marubozu Candlestick?

A Marubozu candlestick is a Japanese candlestick term meaning bald head, referring to a long bodied candle with no or minimal wicks. It highlights complete directional control during one session, where buyers or sellers dominated from open to close. The terminology was widely documented for Western traders through Steve Nison's work on Japanese candlestick charting 


[Nison, S. Japanese Candlestick Charting Techniques — https://www.candlecharts.com ]


Marubozu Identification Checklist

A Marubozu candlestick pattern is easiest to identify using rule based checks. A Marubozu candle is built from OHLC data: Open, High, Low, Close, plus the body (open to close) and wicks (shadows). 

Key Characteristics

  • Body dominance: The real body is large versus the recent average body size

  • Wick threshold: Upper wick and lower wick are minimal relative to the full candle range

  • Close location: Close is near the high for bullish Marubozu, near the low for bearish Marubozu

  • Full vs near Marubozu: A full Marubozu has no meaningful wicks, a near Marubozu has small wicks but the control story stays clear

  • Context: The Marubozu forms with trend, at support or resistance, or during a clean breakout

  • Hold check: The next candle does not immediately snap back through the key level or midpoint

Pro Tip: Skip Marubozu candles printed inside a tight range unless price closes beyond the range boundary.

Types of Marubozu Candlestick Patterns

Marubozu candle types are directional. Variations describe which wick is missing.

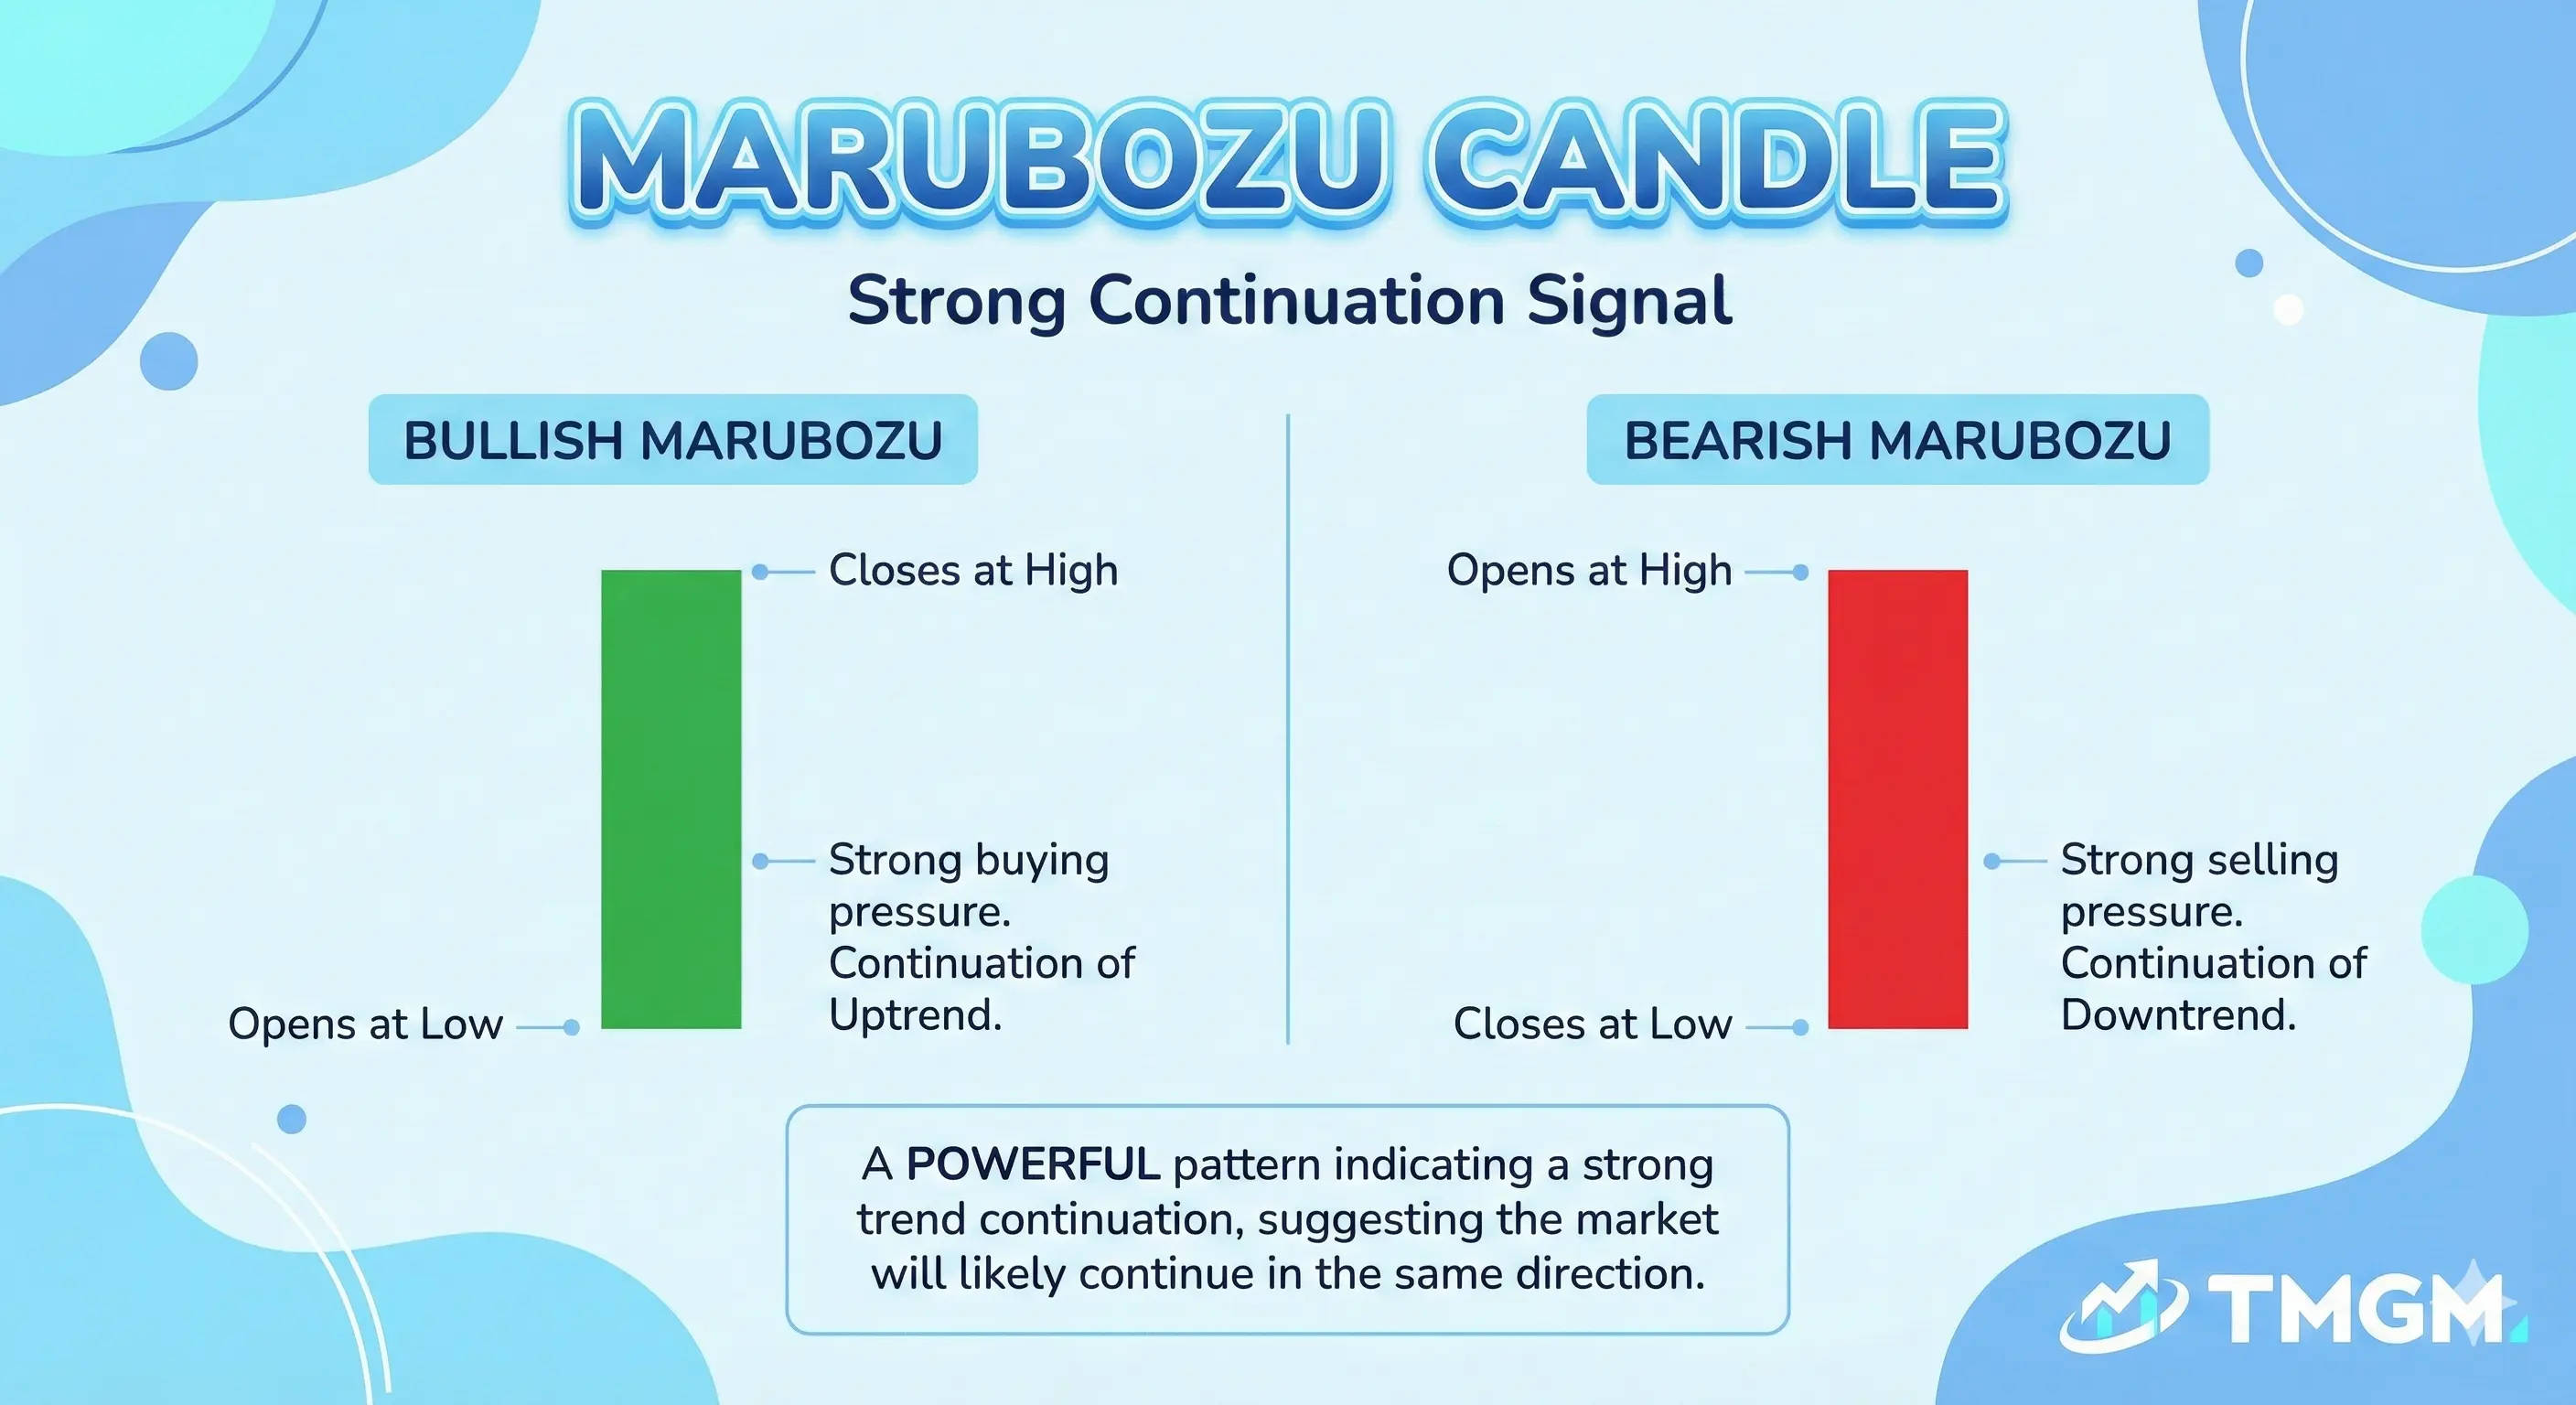
Bullish vs Bearish Marubozu at a Glance
Feature

Bullish Marubozu

Bearish Marubozu

Open

Near session low

Near session high

Close

Near session high

Near session low

Who Controlled

Buyers

Sellers

Primary Signal

Buying pressure

Selling pressure


Bullish Marubozu

A bullish Marubozu opens near the session low and closes near the session high. The long body and minimal wicks signal strong demand control across the session.

Bearish Marubozu

A bearish Marubozu opens near the session high and closes near the session low. The long body and minimal wicks signal strong supply control across the session.

Marubozu Variations (Full, Open and Close)

  • Full Marubozu has no wick on either side. Open and close sit at the session extremes, the strongest and rarest form.

  • Marubozu Open has no wick on the opening side but a small wick on the close, meaning the dominant side faced some opposition late in the session.

  • Marubozu Close is the opposite. Small wick on the open, clean close at the extreme. The dominant side fought early and still won, which many traders consider the more reliable variation.

As wick size increases, the dominance story becomes less clean and the signal is easier to fade.


Trading Significance

A Marubozu candle describes control for one session. Context determines whether control matters. 


Trend Continuation and Reversal Potential

Continuation is the default read when the Marubozu prints with trend. Reversal is a conditional read when a Marubozu prints at major support or resistance and structure shifts on the next swings.

Price Action Mechanism Behind the Pattern

Every Candlestick Pattern formed for a reason, that is called Price Action Analysis. In this case, a Marubozu forms when one side keeps pressing and the other side fails to reverse the price. Bullish Marubozu candles often include aggressive buying and short covering. Bearish Marubozu candles often include liquidation and risk reduction.


How to Trade Marubozu Candlestick Patterns

Use the Marubozu as an entry timing tool tied to structure.

Marubozu Trading Strategies

Marubozu trading strategies work best when the candle appears in two high probability situations: a breakout close or a trend continuation signal after a pullback.

  • Breakout strategy: Trade in the candle direction when a bullish Marubozu closes above resistance or a bearish Marubozu closes below support. 

    • Quality of the setup improves if the next candle holds after retesting the new support or resistance.

  • Trend continuation strategy: Trade with the dominant trend after marubozu candle appearance, with the help of confirmation signals.

Important: The Marubozu high and low often act as reference levels after the candle prints. Treat the high as resistance and the low as support, then watch the next retest for acceptance or rejection.

Using Marubozu for Trend Continuation

  • Bullish continuation: A marubozu can support a continuation setup when it appears in the direction of an existing uptrend. 

  • Bearish continuation: A marubozu can support a continuation setup when it appears in the direction of an existing downtrend. 

Continuation strategies work best when the trader uses the higher timeframe to confirm trend and re-validating that the current market structure is intact.

Using Marubozu for Trend Reversals

  • Bullish reversal attempt: A bullish Marubozu forming at a major support. 

    • Better if the price breaks the prior swing high to confirm structure shift.

  • Bearish reversal attempt: A bearish Marubozu forming at major resistance. 

    • Better if the price breaks the prior swing low to confirm structure shift.

Reversal strategies require strong confirmation signals regarding momentum shifting from one side to the other.

Use Proper Confirmation Rules Before Entering a Trade

  • Context filter (location, space, timeframe): Prioritize Marubozu candles that print at a real support or resistance level or a breakout zone, with clear room to the next major level. Give more weight to daily and weekly Marubozu candles, since the same shape on a five minute chart can flip fast.

  • Look for follow-through: The next candle holds the move and stays clear of the broken level.

  • Volume Price Analysis:

    • Helps confirm a Trend Continuation

    • Helps confirm a Momentum shift for Trend Reversals.

  • Using Support and Resistance Levels

    • Breakout: Bullish Marubozu closes above resistance, then resistance holds as support on retest

    • Breakdown: Bearish Marubozu closes below support, then support holds as resistance on retest


How to place Entry and Exit when trading Marubozu Candlesticks

Entry Placement

  • Close entry: Enter after the Marubozu closes in the direction of the current dominant trend, best when price has already broken a key level.

  • Break entry: Enter on the new candle breaking the Marubozu high for bullish, or the break of the Marubozu low for bearish

  • Retest entry: Enter on pullback to the breakout level, best for controlling risk reward

Exit Placement

Exit Level: Map the target price level to the next support or resistance zone. 

Stop loss: Place the stop just below the low of a bullish Marubozu, or just above the high of a bearish Marubozu.

Pro Tip: The exit strategy is more refined when partial profit is taken at the first nearby level, while the remaining position trails market structure.


Risk Management

Applying proper risk management when executing a Marubozu trade helps control potential losses if momentum fails.

  • Stop placement should go beyond the Marubozu low for bullish setups and beyond the high for bearish setups.

  • Position sizing is based on stop distance. A large Marubozu means a wider stop, so size should come down to keep risk consistent.

  • Slippage is a real cost on fast moving candles, especially around news. Effective risk can be wider than the planned stop if fill quality is poor.

  • Trade management is straightforward. Take partial profit at the first nearby level, then trail the remainder using structure.

Important: If stop distance forces poor risk reward, wait for a retest entry or skip the trade.

Limitations and Considerations

A Marubozu candle does not guarantee continuation. A Marubozu shows who dominated one session, giving insights to the current dominating side, not a future predicting indicator.

  • Wide stop requirement: Long bodies can force wide stops and reduce risk reward if chased

  • News driven Marubozu: Event candles can be one time positioning, not durable sentiment

  • Timeframe trap: A bearish Marubozu on a five minute chart inside a daily uptrend is often noise

  • Illiquid market distortion: Thin markets can print Marubozu shaped candles without real conviction, slippage risk increases


FAQs

  1. What does a Marubozu candle mean?

A Marubozu candlestick means buyers or sellers controlled the session from open to close, shown by a long body and minimal wicks.

  1. How to trade Marubozu?

Trade a Marubozu candle with trend and support or resistance context, enter after close or on retest, and invalidate beyond the candle extreme.

  1. What does Marubozu mean in Japanese?

Marubozu is commonly translated as bald head, referring to missing shadows on the candlestick.

  1. What is the difference between a Bullish and Bearish Marubozu?

A bullish Marubozu closes near the high and signals buyer control. A bearish Marubozu closes near the low and signals seller control.

  1. How can I confirm a Marubozu signal?

Confirm a Marubozu signal using next candle follow through, a hold of support or resistance levels, and stronger volume when volume data is reliable.



Check More Neutral Candlestick Patterns

Neutral Pattern

Features

Doji Pattern

The doji is a single candle that opens and closes at or near the same price, which shows indecision between buyers and sellers.

1. The body is very small or appears as a thin line.

2. The upper and lower shadows can be any length.

3. A doji after a strong trend can warn of a reversal, and traders wait for the next candle to confirm the reversal.

Pin Bar Pattern

The pin bar is a single-candle reversal pattern that can be bullish or bearish.

1. The candle has a small body at one end of its range.

2. One long shadow, called the tail, makes up most of the candle range.

3. A bullish pin bar has a long lower shadow, and a bearish pin bar has a long upper shadow.

Harami Pattern

The harami is a two-candle reversal pattern that can be bullish or bearish.

1. The first candle is a large candle.

2. The second candle is a small candle with a body that sits completely inside the body of the first candle.

3. A bullish harami forms after a downtrend, and a bearish harami forms after an uptrend.

Engulfing Pattern

The engulfing is a two-candle reversal pattern that can be bullish or bearish.

1. The first candle is a small candle.

2. The second candle is a larger candle of the opposite colour, with a body that completely engulfs the body of the first candle.

3. A bullish engulfing forms after a downtrend, and a bearish engulfing forms after an uptrend.

Inside Bar Pattern

The inside bar is a two-candle pattern that can signal a continuation or a reversal.

1. The first candle is a large candle, often called the mother bar.

2. The second candle has a high and low that stay inside the high and low of the first candle.

3. Traders trade the breakout above the high or below the low of the first candle.

Morning Star and Evening Star Pattern

The morning star and evening star are three-candle reversal patterns, one bullish and one bearish.

1. The first candle is a long candle in the direction of the existing trend.

2. The second candle is a small-bodied candle that can be bullish or bearish.

3. The third candle is a long candle in the opposite direction that closes past the midpoint (50%) of the first candle body.

4. A morning star forms after a downtrend, and an evening star forms after an uptrend.


Check More Bearish Candlestick Patterns

Bearish Pattern

Features

Hanging Man Pattern

The hanging man is a single-candle bearish reversal pattern that forms at the top of an uptrend.

1. The candle has a small body at the top of its range.

2. The lower shadow is at least twice the length of the body.

3. The candle has little or no upper shadow.

Shooting Star Pattern

The shooting star is a single-candle bearish reversal pattern that forms after an uptrend.

1. The candle has a small body at the bottom of its range.

2. The upper shadow is at least twice the length of the body.

3. The candle has little or no lower shadow.

Bearish Engulfing Pattern

The bearish engulfing is a two-candle bearish reversal pattern that forms after an uptrend.

1. The first candle is a small bullish candle.

2. The second candle is a larger bearish candle with a body that completely engulfs the body of the first candle.

Bearish Harami Pattern

The bearish harami is a two-candle bearish reversal pattern that forms after an uptrend.

1. The first candle is a large bullish candle.

2. The second candle is a small candle, usually bearish, with a body that sits completely inside the body of the first candle.

Dark Cloud Cover Pattern

Dark cloud cover is a two-candle bearish reversal pattern that forms after an uptrend.

1. The first candle is a long bullish candle.

2. The second candle is a bearish candle that opens above the close of the first candle.

3. The second candle closes below the midpoint (50%) of the first candle body.

Tweezer Top Pattern

The tweezer top is a two-candle bearish reversal pattern that forms at the end of an uptrend.

1. The first candle is a bullish candle.

2. The second candle is a bearish candle.

3. Both candles have the same, or nearly the same, high.

Evening Star Pattern

The evening star is a three-candle bearish reversal pattern that forms after an uptrend.

1. The first candle is a long bullish candle.

2. The second candle is a small-bodied candle that can be bullish or bearish.

3. The third candle is a long bearish candle that closes below the midpoint (50%) of the first candle body.

Three Black Crows Pattern

Three black crows is a three-candle bearish reversal pattern that forms after an uptrend.

1. Three long bearish candles with small shadows form in a row.

2. Each candle opens inside the body of the previous candle.

3. Each candle closes lower than the previous candle.


Check More Bullish Candlestick Patterns

Bullish Pattern

Features

Hammer Pattern

The hammer is a single-candle bullish reversal pattern that forms after a downtrend.

1. The candle has a small body at the top of its range.

2. The lower shadow is at least twice the length of the body.

3. The candle has little or no upper shadow.

Inverted Hammer Pattern

The inverted hammer is a single-candle bullish reversal pattern that forms after a downtrend.

1. The candle has a small body at the bottom of its range.

2. The upper shadow is at least twice the length of the body.

3. The candle has little or no lower shadow.

Dragonfly Doji Pattern

The dragonfly doji is a single-candle bullish reversal pattern that forms at the bottom of a downtrend.

1. The open and close are at or near the high of the candle.

2. The candle has a long lower shadow.

3. The candle has little or no upper shadow.

Bullish Engulfing Pattern

The bullish engulfing is a two-candle bullish reversal pattern that forms after a downtrend.

1. The first candle is a small bearish candle.

2. The second candle is a larger bullish candle with a body that completely engulfs the body of the first candle.

Bullish Harami Pattern

The bullish harami is a two-candle bullish reversal pattern that forms after a downtrend.

1. The first candle is a large bearish candle.

2. The second candle is a small candle, usually bullish, with a body that sits completely inside the body of the first candle.

Piercing Line Pattern

The piercing line is a two-candle bullish reversal pattern that forms after a downtrend.

1. The first candle is a long bearish candle.

2. The second candle is a bullish candle that opens below the close of the first candle.

3. The second candle closes above the midpoint (50%) of the first candle body.

Bullish Kicker Pattern

The bullish kicker is a two-candle bullish reversal pattern that shows a sudden change from selling to buying.

1. The first candle is a bearish candle.

2. The second candle is a bullish candle that gaps up and opens at or above the open of the first candle.

3. The bodies of the two candles do not overlap.

Tweezer Bottom Pattern

The tweezer bottom is a two-candle bullish reversal pattern that forms at the end of a downtrend.

1. The first candle is a bearish candle.

2. The second candle is a bullish candle.

3. Both candles have the same, or nearly the same, low.

Morning Star Pattern

The morning star is a three-candle bullish reversal pattern that forms after a downtrend.

1. The first candle is a long bearish candle.

2. The second candle is a small-bodied candle that can be bullish or bearish.

3. The third candle is a long bullish candle that closes above the midpoint (50%) of the first candle body.

Bullish Abandoned Baby Pattern

The bullish abandoned baby is a three-candle bullish reversal pattern that forms after a downtrend.

1. The first candle is a long bearish candle.

2. The second candle is a doji that gaps down below the first candle.

3. The third candle is a long bullish candle that gaps up above the doji.

Three White Soldiers Pattern

Three white soldiers is a three-candle bullish reversal pattern that forms after a downtrend.

1. Three long bullish candles with small shadows form in a row.

2. Each candle opens inside the body of the previous candle.

3. Each candle closes higher than the previous candle.

Three Inside Up Pattern

The three inside up is a three-candle bullish reversal pattern that forms after a downtrend.

1. The first candle is a large bearish candle.

2. The second candle is a small bullish candle that stays inside the first candle body and closes above the midpoint (50%) of the first candle body.

3. The third candle is a bullish candle that closes above the open of the first candle.

Three Outside Up Pattern

The three outside up is a three-candle bullish reversal pattern that forms after a downtrend.

1. The first candle is a bearish candle.

2. The second candle is a bullish candle with a body that completely engulfs the body of the first candle.

3. The third candle is a bullish candle that closes above the close of the second candle.


TMGM
Trade The World
The TMGM Academy and Market Insights Team is a collective of financial analysts and trading strategists. With access to real-time institutional data and over a decade of market operation, the team provides fact-based analysis on forex, gold, cryptocurrencies, stocks, commodities (like oil), and indices. Our content is strictly regulated, as outlined in our editorial policy page. TMGM adheres to ASIC and VFSC guidelines.
Join Over 1,000,000 clients on our award-winning trading platform
1
Apply for a Live
Account
2
Fund Your
Account
3
Start Trading
Instantly
Open Account