
News & AnalysisCareer

Above $0.0760 at the time of writing on Tuesday, Pi Network (PI) has steadied as the previous day’s roughly 2% recovery stalls. Subdued sentiment across the wider market and lower trading volumes are weighing on the PI token. With the price still below a long-term resistance trendline and momentum weak, the technical picture remains bearish.

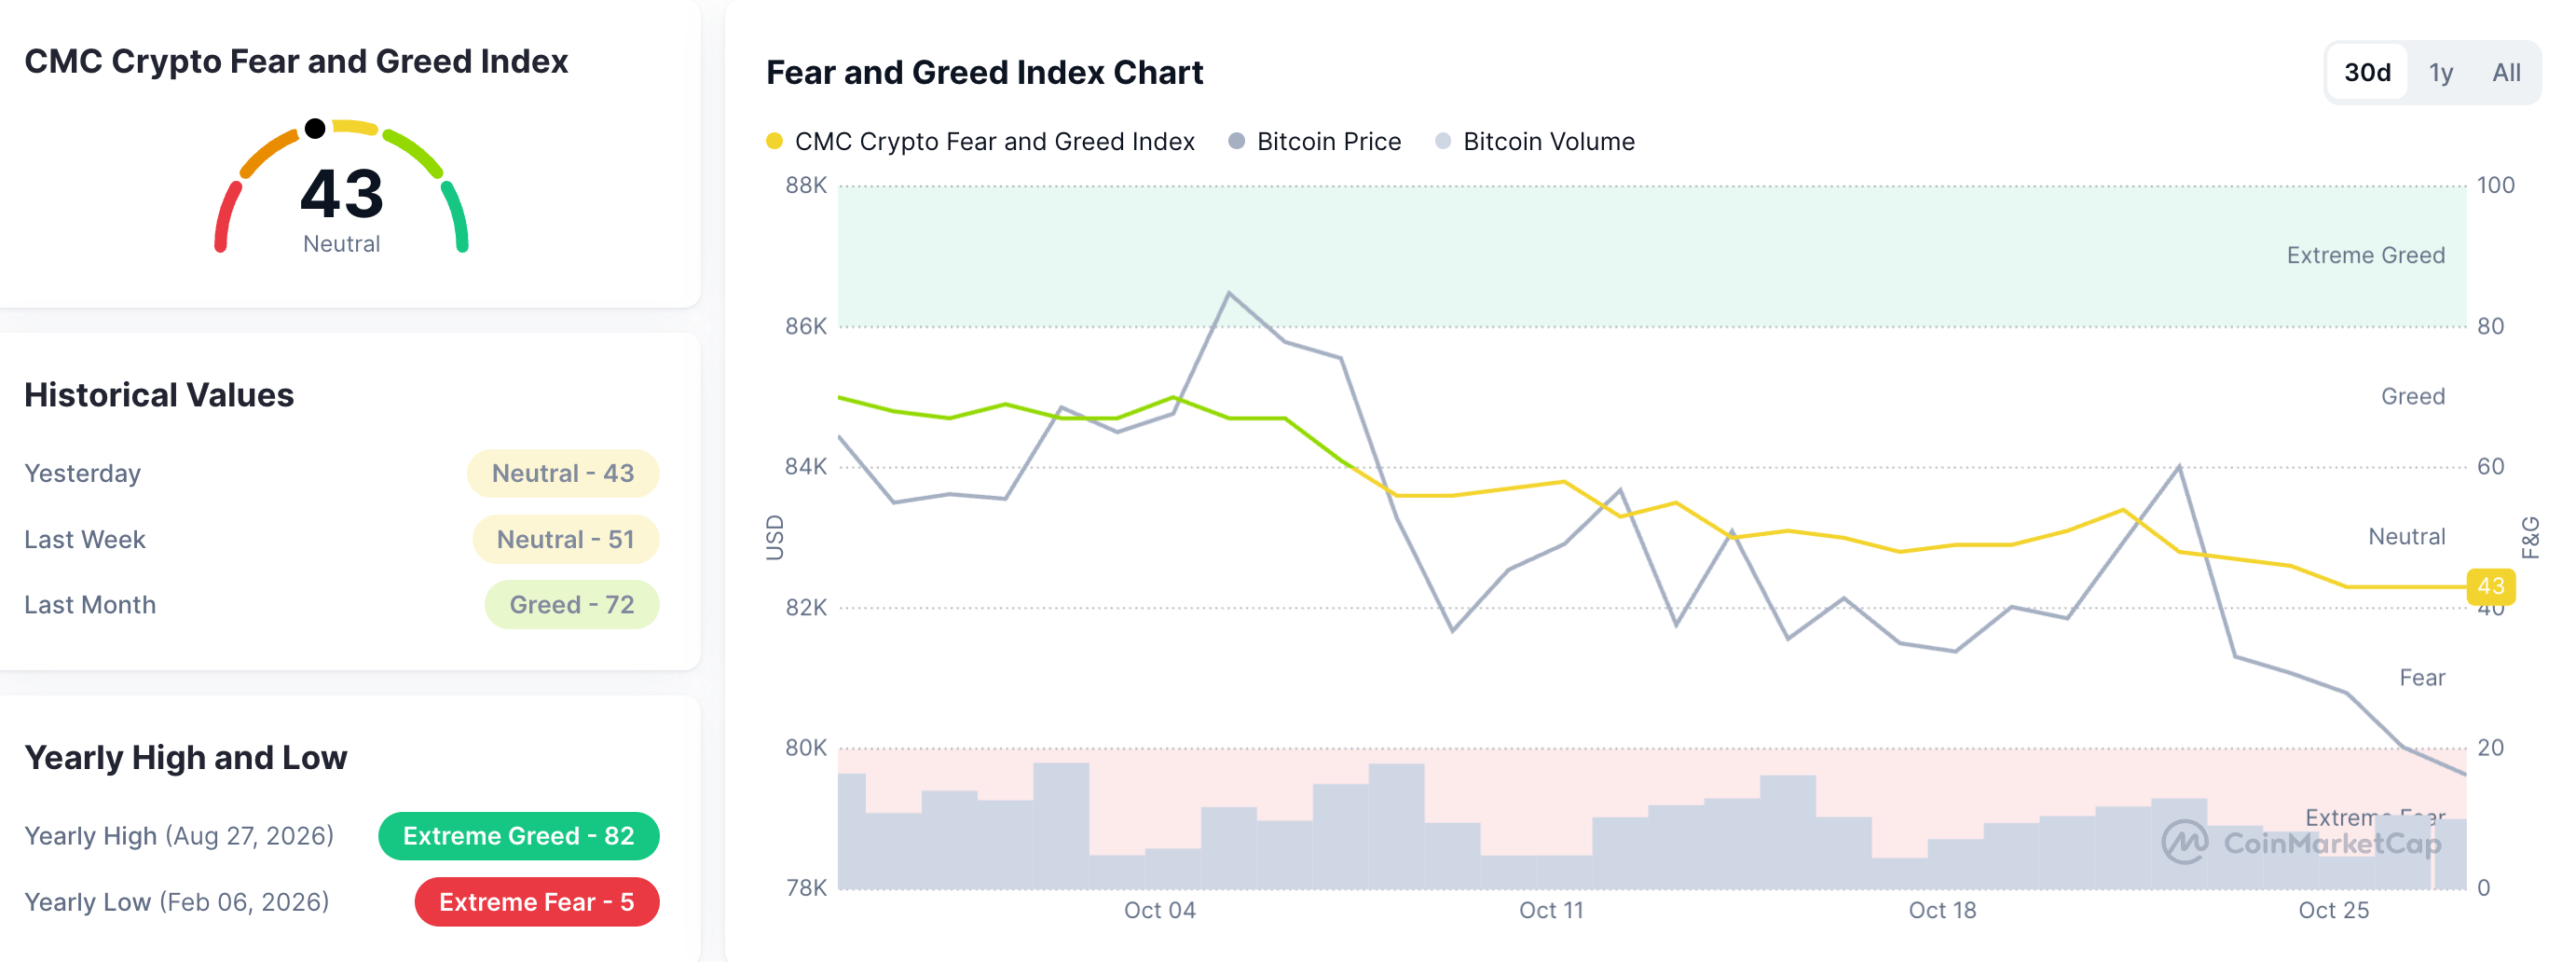
Ahead of potentially volatile events, investor appetite for the wider cryptocurrency market is fading. These include the US midterm elections on 4 November and the US Federal Reserve’s interest rate decision on Wednesday. On Tuesday, CoinMarketCap’s Fear and Greed Index has fallen by 43 points and is hovering towards the lower end of neutral territory, down from 51 last week.
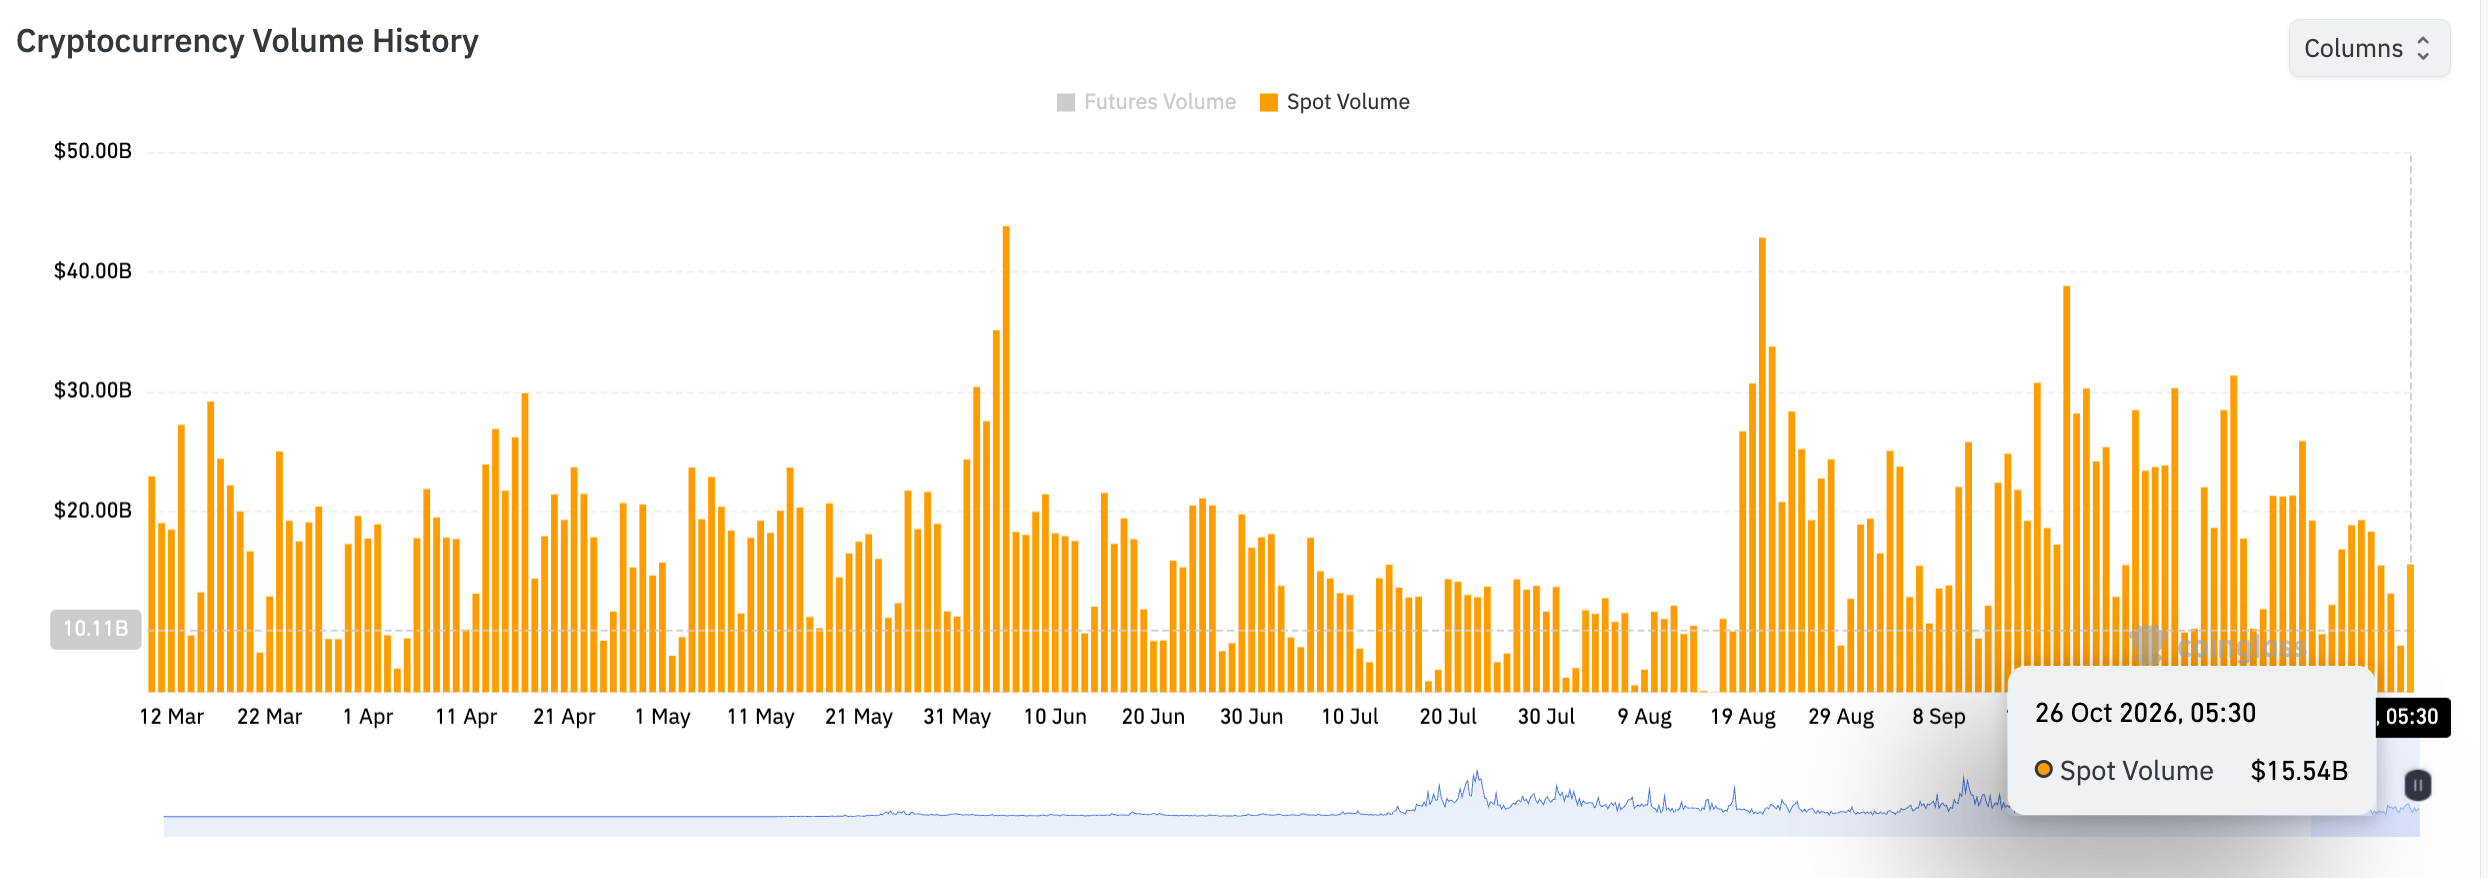
Daily spot trading volumes across the crypto market also remain on a broadly downward path. Monday’s daily turnover reached $15.54 billion, compared with $8.77 billion the day before, according to CoinGlass. Despite that increase, a series of lower highs has formed since 21 September, when spot volume stood at $38.81 billion. The pattern reinforces the picture of waning trader interest amid uncertainty.
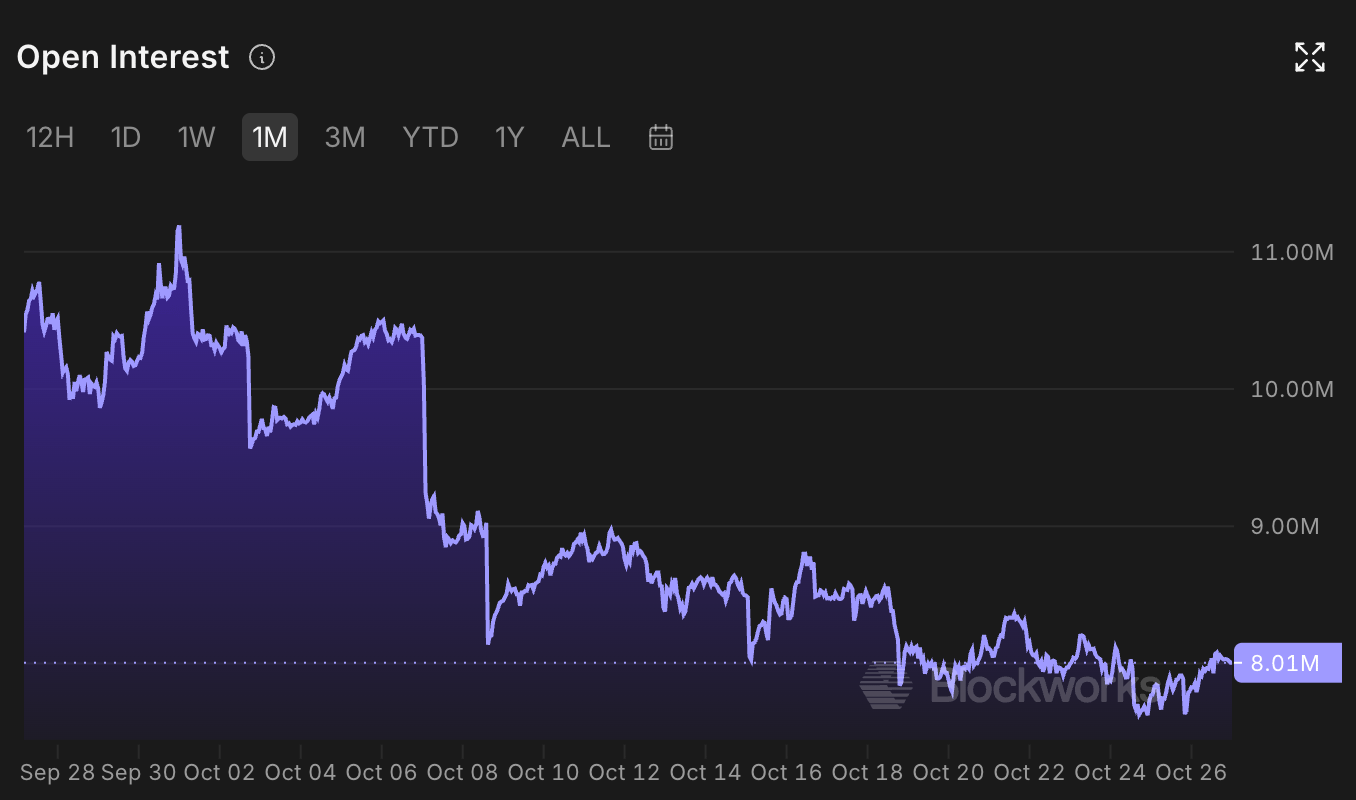
Retail participation in Pi Network is weakening in a similar fashion. At $8.01 million on Tuesday, PI futures Open Interest (OI) is below last week’s $8.36 million, CoinAnk data shows. This points to a lower notional value of outstanding positions. A fall in OI typically reflects either a drop in the spot price or positions being wiped out.
At $0.0763 at the time of writing on Tuesday, Pi Network retains its bearish bias. Recovery attempts remain constrained by the descending resistance trendline at $0.0807, as well as the 50- and 200-day Exponential Moving Averages (EMAs) at $0.0840 and $0.1163, respectively. The PI token trades below all three.
Selling pressure appears persistent across both momentum indicators. The Relative Strength Index (RSI) is around 36, near oversold territory, while the Moving Average Convergence Divergence (MACD) line is levelling off just below zero, leaving momentum fragile.
Any recovery would first encounter resistance at the former trendline near $0.0807. Beyond that lie the 50-day EMA at $0.0840 and the 23.6% Fibonacci retracement at $0.0866, calculated from $0.1394 to $0.0704. Further up, the 50% retracement at $0.1049 and the 200-day EMA near $0.1163 form a broader barrier to a corrective recovery.
Should the pair fall further, buyers could try to arrest the downtrend near $0.0704. This Fibonacci anchor marks the only nearby structural support.
(The technical analysis of this story was written with the help of an AI tool. Know more.)










The information provided on this website is of a general nature only and does not constitute personal financial advice. Before acting on any information on this website, you should consider the suitability of the information in relation to your objectives, financial situation and needs. Investing in CFDs and FX Margin Contracts carries significant risks and is not suitable for all investors. You may lose more than your initial deposit. You do not own, or have, any interest in the underlying asset. We recommend that you seek independent advice and ensure you fully understand the risks involved before trading. It is important that you read and consider the disclosure document before you acquire any product listed on the website. The information and advertisements offered on this website are not intended for use by any person in any country or jurisdiction where such use would be contrary to local laws and regulations. The Products and Services offered on this website are not intended for residents of the United States, Malaysia and Thailand.
TMGM is authorized and regulated in various jurisdictions.
Trademax Australia Limited, trading as TMGM, is regulated by the Australian Securities and Investments Commission (ASIC), AFSL no. 436416 and is located at Level 28, One International Tower, 100 Barangaroo Avenue, 2000 Sydney, NSW Australia.
Email: [email protected]
Trademax Global Limited, trading as TMGM, is authorized and regulated by the Vanuatu Financial Services Commission (VFSC), registration number 40356 and registered at 1276, Kumul Highway, Port Vila, Vanuatu, Republic of Vanuatu.
Email: [email protected]
Trademax Global Markets (SE) Limited, trading as TMGM, is authorized and regulated by the Financial Services Authority (FSA) of Seychelles, with license number SD224. The company is registered at Office No 13, Providence Estate ABIS Centre, Mahe, Seychelles.
Email: [email protected]
Trademax Global Markets (International) Pty Ltd, trading as TMGM, is authorized and regulated by the Financial Services Commission, Mauritius (FSC) with license no. GB22201012, and registered at 33, Edith Cavell Street C/o IQ EQ Fund Services (Mauritius) Ltd Port Louis, 11324 Mauritius.
Email: [email protected]
Copyright © TMGM. All rights reserved

