

Bitcoin Price Forecast: BTC recovery faces headwinds from ETF outflows and elevated Fed rate-hike bets
- Bitcoin is recovering, trading above $78,200 on Monday after a more than 4% pullback the previous week.
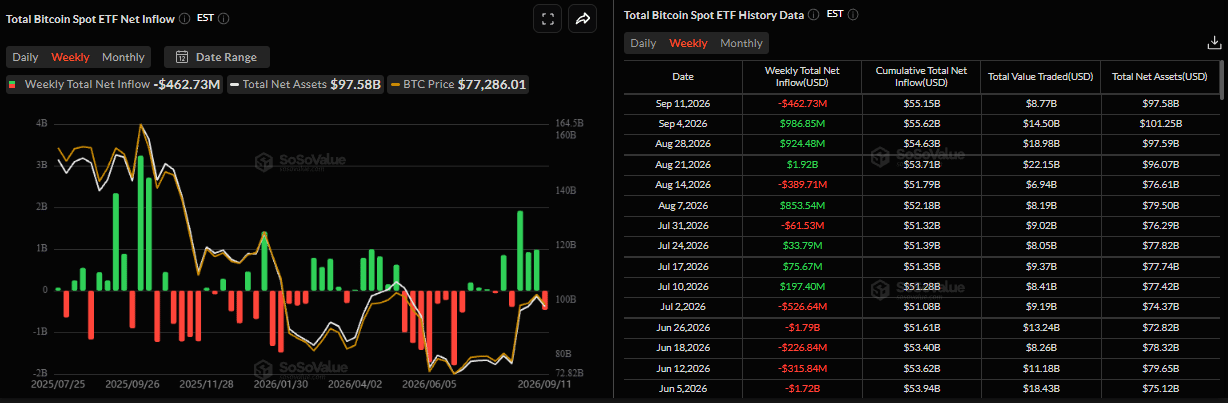
- US-listed spot Bitcoin ETFs recorded an outflow of $462.73 million last week, snapping a three-week inflow streak.
- Elevated Fed rate-hike bets and geopolitical risks are boosting the USD, capping BTC’s upside potential.
Bitcoin (BTC) recovers slightly, trading above $78,200 at the time of writing on Monday after declining over 4% last week. The price correction was supported by weakening institutional demand, with spot Exchange Traded Funds (ETFs) recording over $462 million in net outflows last week, snapping a three-week inflow streak. In addition, elevated bets on Federal Reserve (Fed) rate hikes and escalating tensions in the Middle East continue to support the US Dollar (USD), potentially limiting the Crypto King’s recovery.

Institutional demand weakens
Institutional demand for Bitcoin shows signs of weakness. SoSoValue data showed spot ETFs recorded a $462.73 million outflow last week, breaking the three-week inflow streak. If these withdrawals continue and intensify throughout this week, BTC could see further correction.
Elevated Fed rate-hike bets and geopolitical risks cap BTC
Macroeconomic factors continue to weigh on the Crypto King. Hot US inflation figures released last week raised bets that the Fed will hike interest rates.
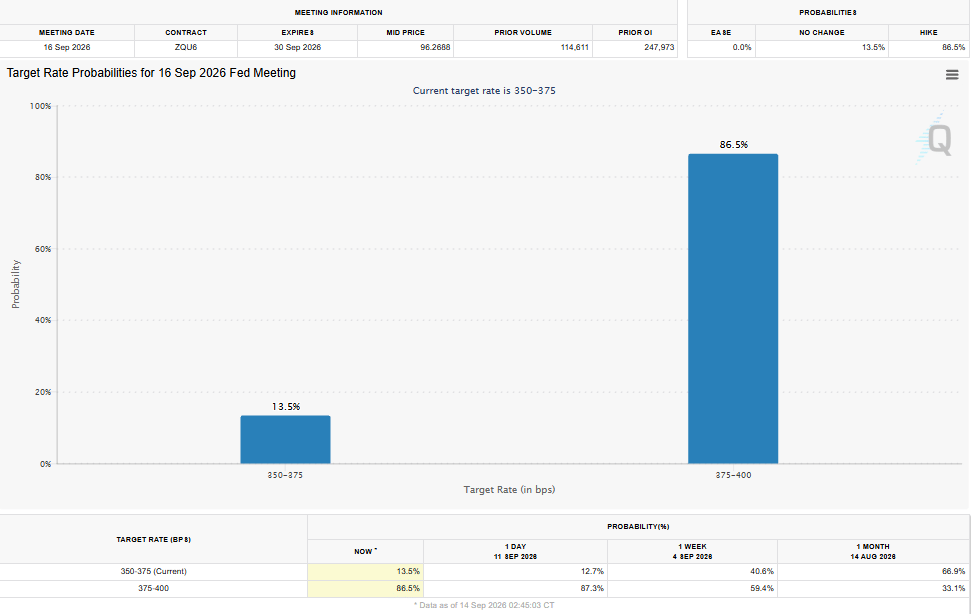
According to CME Group’s FedWatch Tool, traders are currently pricing in over an 86% chance that the US central bank would raise borrowing costs at the end of a two-day meeting on Wednesday. The bets rose on the US Producer Price Index (PPI) and Consumer Price Index (CPI) reports released last week, which indicated persistent wholesale and consumer inflation in August.
Adding to this, persistent geopolitical uncertainties in the Middle East continue to dampen risk appetite. In the latest developments, Iran-backed Houthi fighters in Yemen said that they used drones and missiles to attack a military base in southern Saudi Arabia.
Moreover, a planned regional meeting between Gulf states and Iran regarding the Strait of Hormuz due on Monday has been postponed, keeping the geopolitical risk premium in play and supporting oil prices. These developments have benefited the safe-haven US Dollar (USD) and capped BTC’s upside potential.
Bitcoin technical outlook: Faces rejection from 50-day SMA
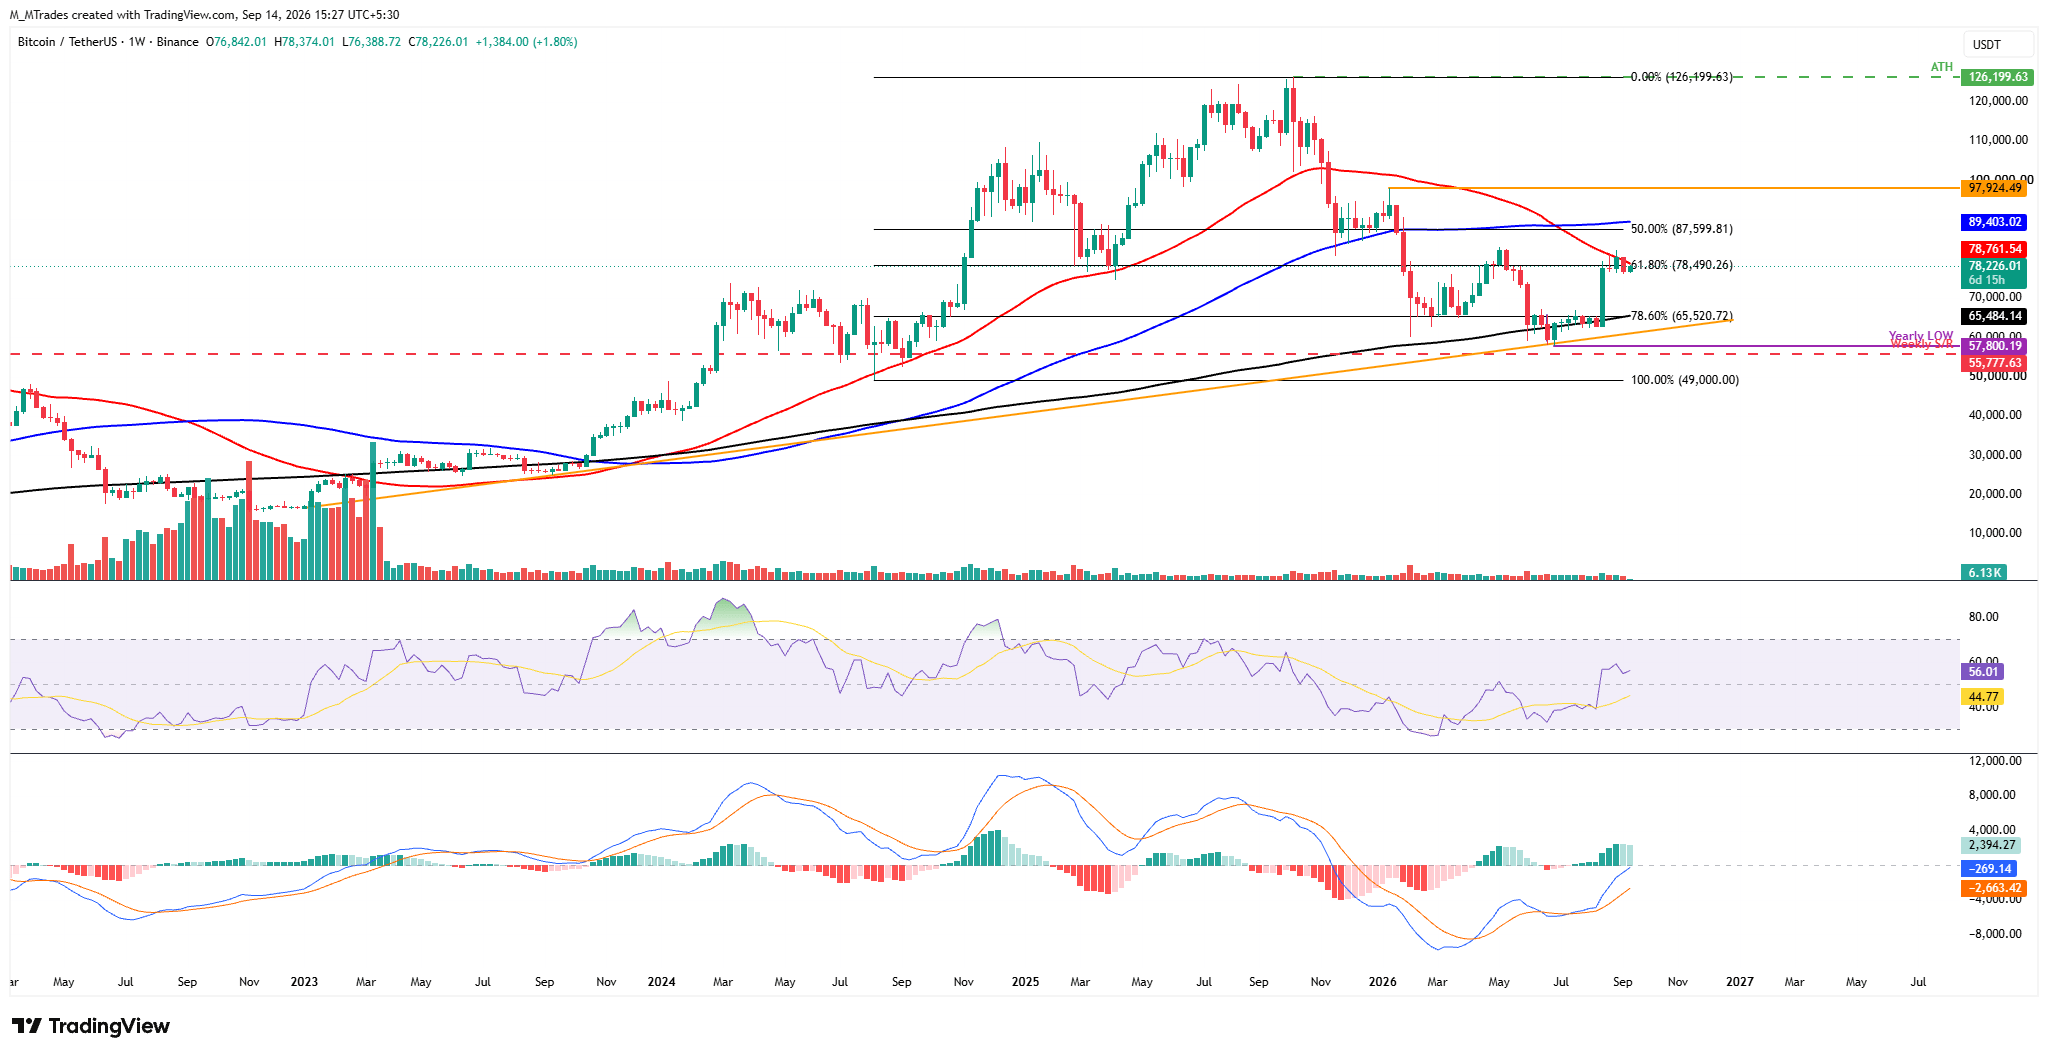
The Crypto King declined over 4% last week after being rejected by the 50-week Simple Moving Average (SMA) at $78,761. At the time of writing on Monday, BTC is trading around $78,226.
If BTC fails to overcome the 50-day SMA at $78,761 resistance and corrects, BTC could extend the decline toward the key psychological level of $70,000.
The Relative Strength Index (RSI) on the weekly chart around 56 shows mildly positive momentum without reaching overbought conditions. At the same time, the Moving Average Convergence Divergence (MACD) remains firmly in positive territory, hinting that upside pressure persists despite nearby resistance.
On the other hand, if BTC recovers and closes above the 50-week SMA at $78,761 on a weekly basis, it could extend the rally toward the 50% Fibonacci retracement level at $87,599 (drawn from the August 2024 low of $49,000 to the October 2025 record high of $126,199), followed by the 100-week SMA at $89,403.
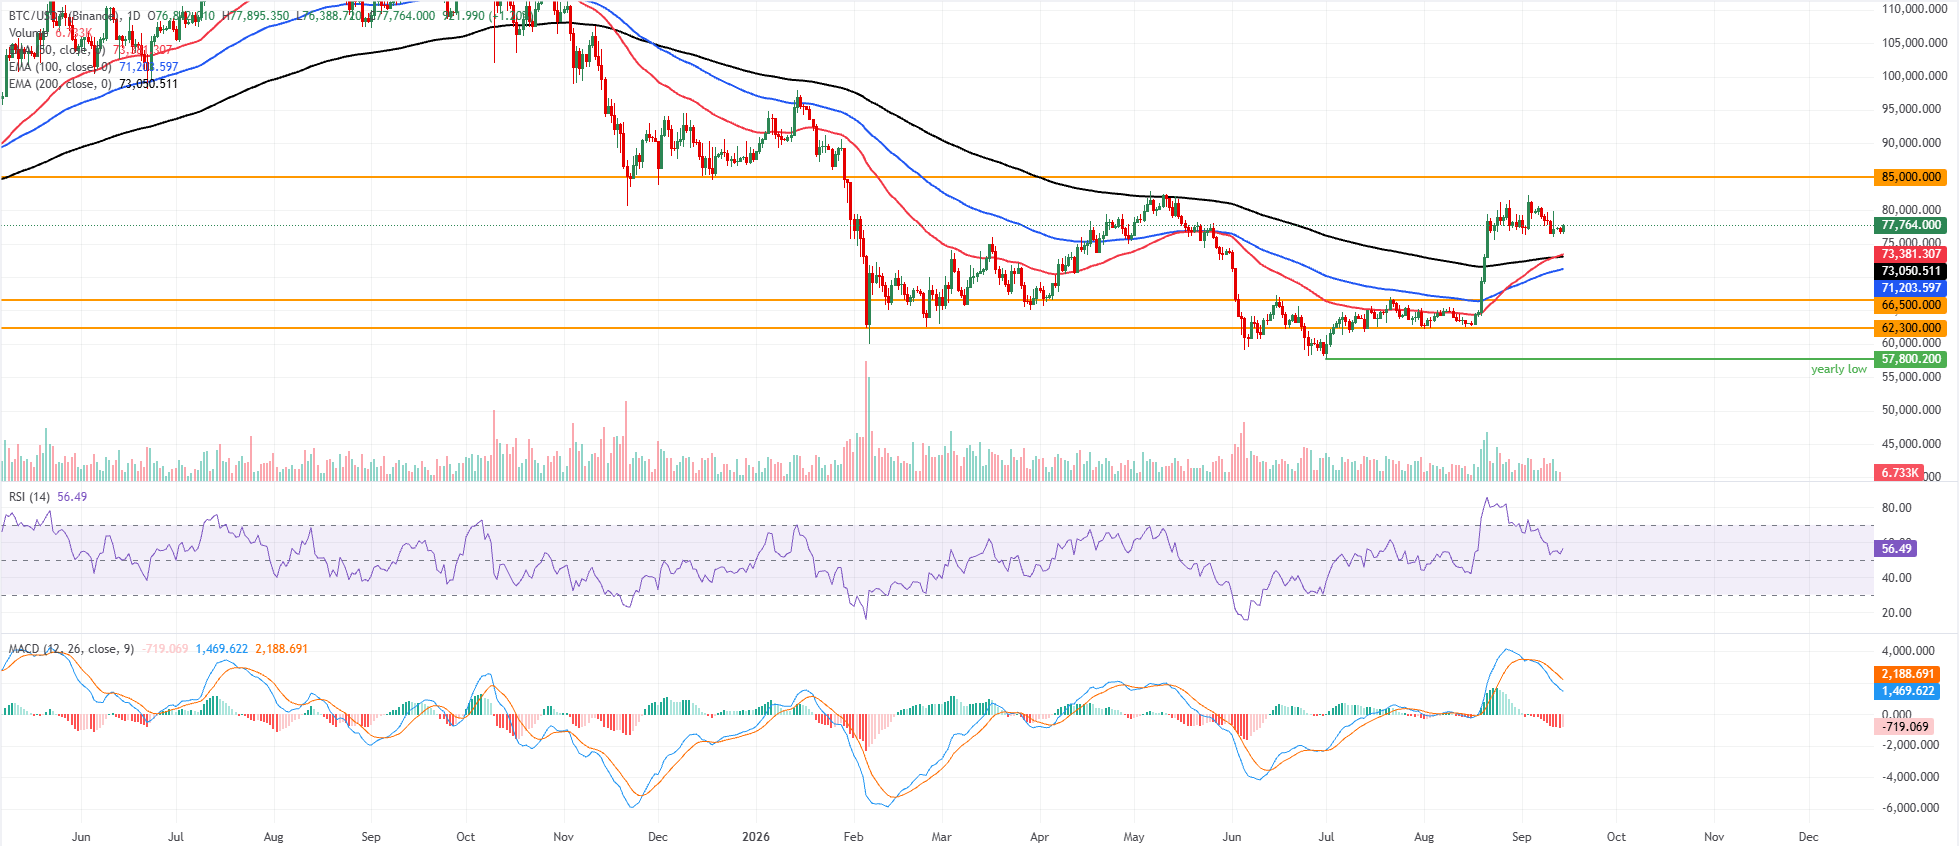
On the daily chart, BTC maintains a bullish near-term bias as price holds well above the 50-day, 100-day, and 200-day Exponential Moving Averages (EMAs), clustered between roughly $71,200 and $73,400.
The regrouping over these EMA supports suggests the broader uptrend remains intact, while the daily RSI at 56 leans slightly positive without showing overbought conditions. By contrast, the MACD stays below the zero line with a negative reading, suggesting upside momentum is not yet aggressive despite the supportive price structure.
On the downside, immediate support sits around the 50-day EMA at $73,381 and the 200-day EMA at $73,050, followed by the 100-day EMA near $71,203, reinforcing a wide demand zone beneath spot. Deeper pullbacks would target horizontal supports at $66,500 and then $62,300 if selling pressure accelerates.
On the topside, the next key resistance sits at the horizontal barrier near $85,000, and a sustained break above this level would reopen the path toward fresh highs in the prevailing bullish framework.
(The technical analysis of this story was written with the help of an AI tool. Know more.)
Bitcoin, altcoins, stablecoins FAQs
Bitcoin is the largest cryptocurrency by market capitalization, a virtual currency designed to serve as money. This form of payment cannot be controlled by any one person, group, or entity, which eliminates the need for third-party participation during financial transactions.
Altcoins are any cryptocurrency apart from Bitcoin, but some also regard Ethereum as a non-altcoin because it is from these two cryptocurrencies that forking happens. If this is true, then Litecoin is the first altcoin, forked from the Bitcoin protocol and, therefore, an “improved” version of it.
Stablecoins are cryptocurrencies designed to have a stable price, with their value backed by a reserve of the asset it represents. To achieve this, the value of any one stablecoin is pegged to a commodity or financial instrument, such as the US Dollar (USD), with its supply regulated by an algorithm or demand. The main goal of stablecoins is to provide an on/off-ramp for investors willing to trade and invest in cryptocurrencies. Stablecoins also allow investors to store value since cryptocurrencies, in general, are subject to volatility.
Bitcoin dominance is the ratio of Bitcoin's market capitalization to the total market capitalization of all cryptocurrencies combined. It provides a clear picture of Bitcoin’s interest among investors. A high BTC dominance typically happens before and during a bull run, in which investors resort to investing in relatively stable and high market capitalization cryptocurrency like Bitcoin. A drop in BTC dominance usually means that investors are moving their capital and/or profits to altcoins in a quest for higher returns, which usually triggers an explosion of altcoin rallies.














