

Trading
Explore a wide range of markets with competitive pricing, deep liquidity, and advanced trading tools.
Learn More 
Platform
Trade seamlessly with TMGM's powerful platform, built for speed, precision, and a superior trading experience.
Learn More Trading Platform
Academy
Learn the fundamentals of trading with beginner-friendly resources, including guides, webinars, and market insights.
Learn More News & Analysis
Get real-time market updates and expert analysis to stay ahead of trading opportunities
Learn More News & Analysis
About
Learn what sets TMGM apart — our global presence, regulatory strength, and commitment to innovation in trading.
Learn More Why Choose TMGM
Sponsorship
The British Pound catches second wind as soft PCE knocks Fed hike bets
- GBP/USD climbs as softer PCE flips October odds toward hold.
- UK growth beats forecasts, adding support to Sterling recovery.
- ADP strength and resilient GDP keep Fed outlook data-dependent.
The Pound Sterling registers solid gains versus the US Dollar on Wednesday, edges up 0.42% as the latest US inflation figures were below estimates, reaffirming NY Fed President Williams comments that they are in no rush to tighten monetary policy. This, along with solid growth figures in the UK, boosted GBP/USD to current spot prices near 1.3280.

Sterling rallies as cooler US inflation collides with stronger UK growth
On Tuesday, several Fed officials crossed the wires, with St. Louis Fed Musalem, Chicago Fed Goolsbee, and Fed Governor Barr delivering hawkish remarks ahead of the Core Personal Consumption Expenditures (PCE) Price Index release, which came in below estimates and caught investors off guard, after they had priced in a Fed October hike.
US core figures in August came in at 3% YoY below estimates of 3.3% and were unchanged from July’s print. Headline PCE stood at 3.4% YoY, unchanged from the previous number and also below forecasts for a 3.7% jump, triggering
Other data showed that the US economy grew 2.2% in the final reading for the second quarter of 2026, exceeding forecasts of 1.5%, while ADP jobs data showed private companies hired over 90K people in September, above 70K, indicating a solid labour market.
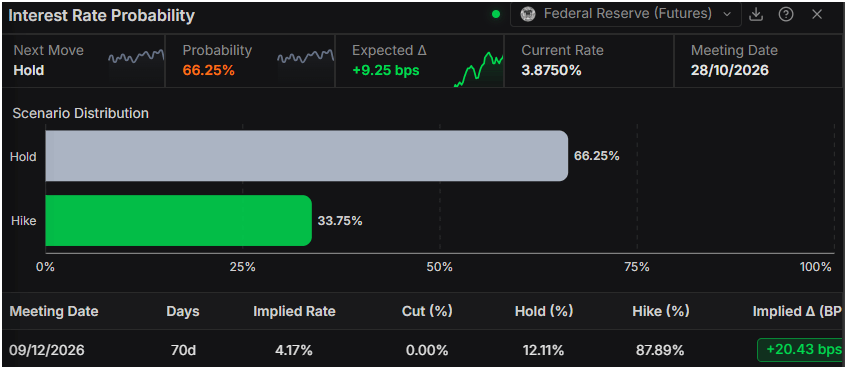
Given the backdrop, money markets shifted from expecting a rate hike to a hold for the October 28 meeting. The odds stand at 66% for a hold, and nearly 34% chances for a rate hike, revealed Prime Terminal.
The Greenback fell after the data, and the US Dollar Index (DXY), which tracks the buck’s performance versus six currencies, is down 0.08% to 101.29.
In the UK, the Office for National Statistics (ONS) reported that GDP in Q2 improved to 0.5% QoQ, up from the expected 0.4%, following growth of 0.4% in Q1. Although the news provides some relief for Pound buyers, traders' focus is on fiscal policy as they await Prime Minister Andy Burnham's Autumn Budget, as well as his openness for a potential “rejoin” of the European Union.
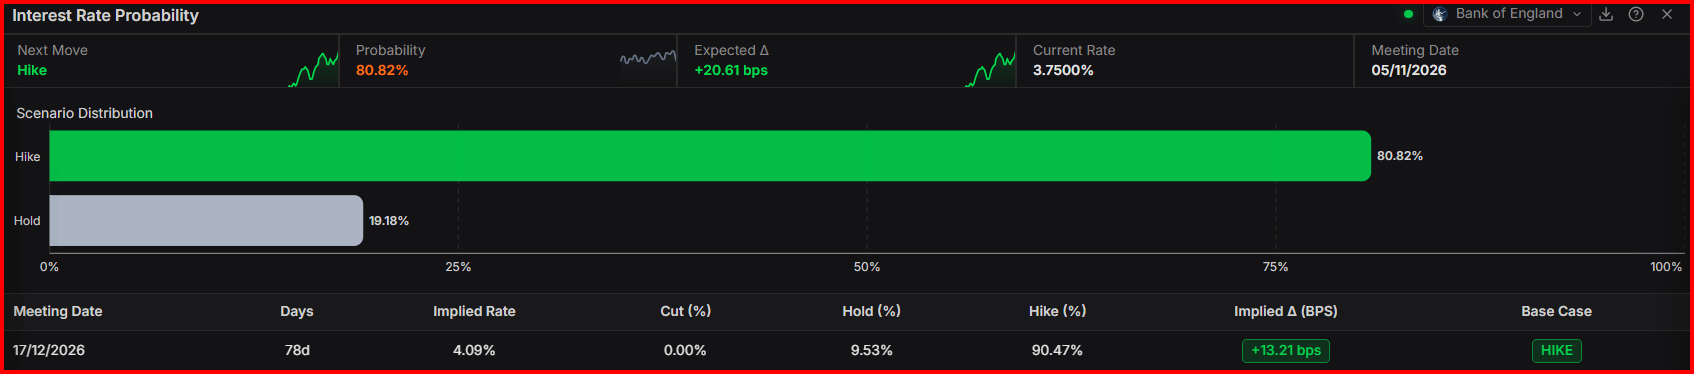
Money markets are pricing in near 33 basis points of tightening from the Bank of England towards the end of 2026 and more than 100 basis points by the end of the next year,
GBP/USD Price Forecast: Technical outlook
In the daily chart, GBP/USD trades at 1.3278, extending a bearish tone as the pair holds below the cluster of longer-term simple moving averages (SMAs) grouped around 1.3457 and under multiple broken trend-line levels now acting as overhead supply. The Relative Strength Index (14) at 36.5 hovers just above oversold territory, hinting that downside momentum remains in place but is no longer as aggressive as in prior sessions.
On the topside, initial resistance emerges at the downward trend-line break near 1.3318, with the more significant cap formed by the confluence of a resistance trend line around 1.3437 and the triple SMA cluster near 1.3457. Above that, the former upward support trend lines, now turned resistance at approximately 1.3536 and 1.3738, delineate the next barriers for any corrective bounce, while the absence of clearly defined nearby supports below the market leaves the pair vulnerable to further declines until a new base is established.
(The technical analysis of this story was written with the help of an AI tool. Know more.)
Pound Sterling Price This Month
The table below shows the percentage change of British Pound (GBP) against listed major currencies this month. British Pound was the strongest against the New Zealand Dollar.
| USD | EUR | GBP | JPY | CAD | AUD | NZD | CHF | |
|---|---|---|---|---|---|---|---|---|
| USD | 2.29% | 2.05% | -1.62% | 2.47% | 2.98% | 4.78% | 3.26% | |
| EUR | -2.29% | -0.22% | -3.84% | 0.16% | 0.68% | 2.43% | 0.94% | |
| GBP | -2.05% | 0.22% | -3.63% | 0.38% | 0.90% | 2.67% | 1.19% | |
| JPY | 1.62% | 3.84% | 3.63% | 4.14% | 4.68% | 6.44% | 5.02% | |
| CAD | -2.47% | -0.16% | -0.38% | -4.14% | 0.52% | 2.21% | 0.78% | |
| AUD | -2.98% | -0.68% | -0.90% | -4.68% | -0.52% | 1.74% | 0.29% | |
| NZD | -4.78% | -2.43% | -2.67% | -6.44% | -2.21% | -1.74% | -1.46% | |
| CHF | -3.26% | -0.94% | -1.19% | -5.02% | -0.78% | -0.29% | 1.46% |
The heat map shows percentage changes of major currencies against each other. The base currency is picked from the left column, while the quote currency is picked from the top row. For example, if you pick the British Pound from the left column and move along the horizontal line to the US Dollar, the percentage change displayed in the box will represent GBP (base)/USD (quote).
POPULAR ARTICLES
1Australian Dollar reverses post-PCE rebound as US Dollar recovers2Bitcoin’s 4-year cycle looks self-fulfilling, but RWA may define what's next – ARK Invest3Silver Price Forecast: XAG/USD remains vulnerable near $604The British Pound catches second wind as soft PCE knocks Fed hike bets5China: Targeted support and cautious stabilization signs – Societe Generale6EUR/USD: Measured ECB tightening to support Euro – TD Securities7Japanese Yen advances as US PCE shifts Fed rate hike bets toward December8Euro finds support as softer US PCE data prompts traders to trim Fed rate-hike bets9United States Chicago PMI came in at 58.8, above expectations (51.2) in September
LIVE QUOTES


ALL ABOUT FOREX
What Is an Islamic Account in Forex?
Best Indicators for Forex Trading and How to Use Them
The Top 10 Most Traded Currency Pairs in the World
What are the Major Forex Pairs? 7 Major Currency Pairs in the World
5 Best Forex Trading Apps In India In 2026
Top 15 Weakest Currencies in the World
Best Time to Trade Forex
Forex Trading Regulations in India
How to Start Forex Trading in India: A Guide for Beginners
Get Started!
Sign up and access the Global Markets in less than 3 minutes

Connect With Us












The information provided on this website is of a general nature only and does not constitute personal financial advice. Before acting on any information on this website, you should consider the suitability of the information in relation to your objectives, financial situation and needs. Investing in CFDs and FX Margin Contracts carries significant risks and is not suitable for all investors. You may lose more than your initial deposit. You do not own, or have, any interest in the underlying asset. We recommend that you seek independent advice and ensure you fully understand the risks involved before trading. It is important that you read and consider the disclosure document before you acquire any product listed on the website. The information and advertisements offered on this website are not intended for use by any person in any country or jurisdiction where such use would be contrary to local laws and regulations. The Products and Services offered on this website are not intended for residents of the United States, Malaysia and Thailand.
TMGM is authorized and regulated in various jurisdictions.
Trademax Australia Limited, trading as TMGM, is regulated by the Australian Securities and Investments Commission (ASIC), AFSL no. 436416 and is located at Level 28, One International Tower, 100 Barangaroo Avenue, 2000 Sydney, NSW Australia.
Email: [email protected]
Trademax Global Limited, trading as TMGM, is authorized and regulated by the Vanuatu Financial Services Commission (VFSC), registration number 40356 and registered at 1276, Kumul Highway, Port Vila, Vanuatu, Republic of Vanuatu.
Email: [email protected]
Trademax Global Markets (SE) Limited, trading as TMGM, is authorized and regulated by the Financial Services Authority (FSA) of Seychelles, with license number SD224. The company is registered at Office No 13, Providence Estate ABIS Centre, Mahe, Seychelles.
Email: [email protected]
Trademax Global Markets (International) Pty Ltd, trading as TMGM, is authorized and regulated by the Financial Services Commission, Mauritius (FSC) with license no. GB22201012, and registered at 33, Edith Cavell Street C/o IQ EQ Fund Services (Mauritius) Ltd Port Louis, 11324 Mauritius.
Email: [email protected]
Copyright © TMGM. All rights reserved