

Trading
Explore a wide range of markets with competitive pricing, deep liquidity, and advanced trading tools.
Learn More 
Platform
Trade seamlessly with TMGM's powerful platform, built for speed, precision, and a superior trading experience.
Learn More Trading Platform
Academy
Learn the fundamentals of trading with beginner-friendly resources, including guides, webinars, and market insights.
Learn More News & Analysis
Get real-time market updates and expert analysis to stay ahead of trading opportunities
Learn More News & Analysis
About
Learn what sets TMGM apart — our global presence, regulatory strength, and commitment to innovation in trading.
Learn More Why Choose TMGM
Sponsorship
Ethereum slips below $2,400 as Oil surges, ETF outflows mount
- Ethereum faces selling pressure near $2,400 as Oil prices rise.
- Ethereum exchange reserves climb by 290K ETH while ETFs are on track for two weeks of outflows.
- ETH tests the $2,411 support after rejection at the 50-day EMA.
Ethereum (ETH) declined 1% on Friday, briefly dropping below $2,400 following rising Oil prices.
Brent Crude has jumped 3.6% to 109.7 at the time of writing, reaching its highest level since May. The spike in Oil prices has pressured risk assets, with cryptos declining alongside equities, highlighting increasing correlation between the two asset classes.

The crypto market is down 1.3% while the S&P 500 has dropped by 1.4%, eyeing its lowest close since mid-September. The tech-heavy Nasdaq bore most of the brunt, sliding by 2.3% amid selloffs in AI-related stocks.
The drop follows hot wholesale and consumer inflation readings over the past two days, fueled by rising energy prices. The Producer Price Index (PPI) and Consumer Price Index (CPI) both beat market forecasts in September, coming in at 6.3% and 3.7% YoY versus estimates of 5.3% and 3.6%, respectively.
ETH selloff increases following rising exchange reserves and ETF outflows
Ethereum continues to face liquidation pressure, with $72 million wiped off the market, based on data from exchanges tracked by Coinglass. Long traders in ETH futures have now recorded roughly 500 million in liquidations since Monday.
The pressure is more evident on the spot side. Ethereum exchange reserves, which track the total amount of a crypto asset held across exchange wallets, have increased by about 290K ETH over the past three weeks, their highest since September 10. That suggests rising sell-side pressure, as shown by ETH's decline.
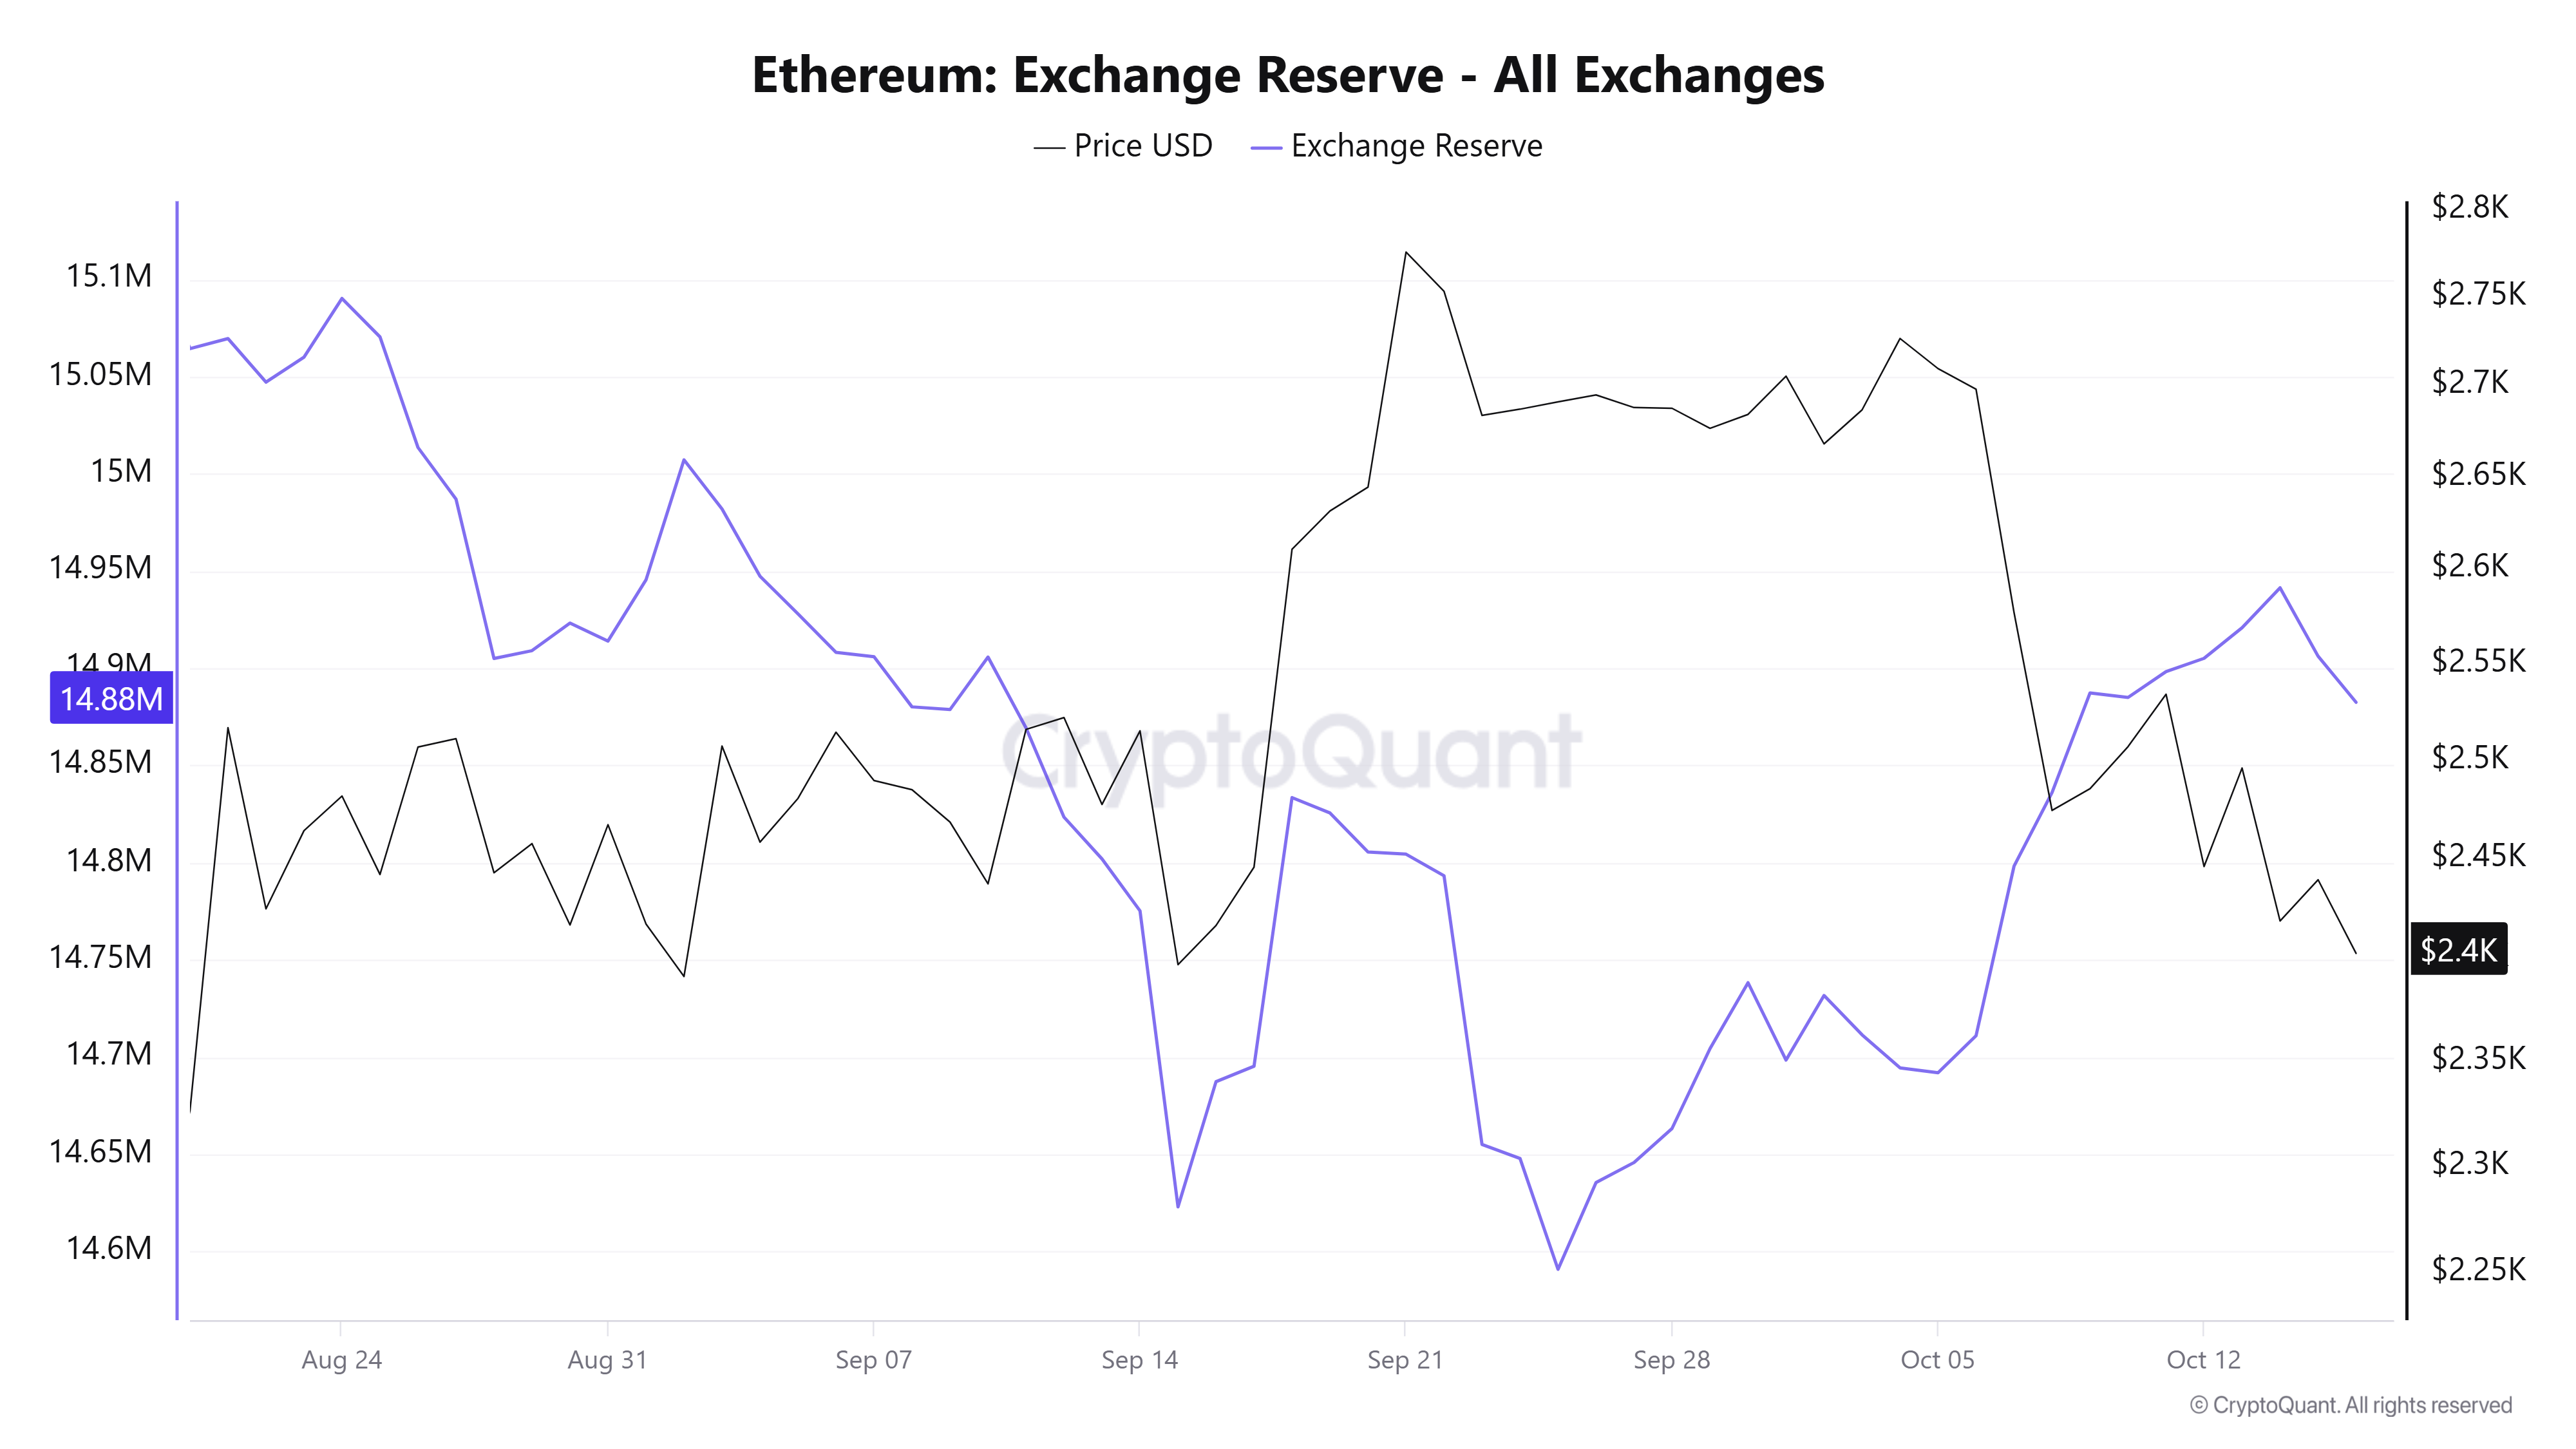
US spot ETH exchange-traded funds (ETFs) tell the same story, posting net outflows of $60.2 million on Thursday, per SoSoValue data. The products are on track for a second consecutive week of net outflows after recording withdrawals in 12 out of the last 13 trading days.
Ethereum technical outlook: ETH tests $2,411 support
On the daily chart, ETH is keeping a bearish near-term tone as price has slipped below the 50-day and 20-day Exponential Moving Averages (EMAs) at $2,492 and $2,538, respectively. The top altcoin holds above the 100-day EMA at $2,347.87, which offers tentative trend support, but the failure to sustain above the shorter EMAs hints at waning bullish control.
The 14-day Relative Strength Index (RSI) at 38 and the Stochastic Oscillator (Stoch) near 23 lean toward bearish momentum.
On the downside, immediate support is near the latest close around $2,414, followed by the nearby horizontal floor at $2,355 and the 100-day EMA. A decisive break below this area could open the way toward deeper supports at $2,204 and $1,971.
On the topside, initial resistance emerges at the 50-day EMA, ahead of the horizontal barrier at $2,548 and the 20-day EMA, forming a dense supply zone, with further upside hurdles at $2,636 and $2,781.
(The technical analysis of this story was written with the help of an AI tool. Know more.)
POPULAR ARTICLES
1Ethereum slips below $2,400 as Oil surges, ETF outflows mount2Canada: Energy-driven resilience with limited core pass-through – RBC3Taiwan Dollar: Foreign outflows pressure currency – OCBC4Silver Price Forecast: Bears target $55 as RSI nears oversold5Gold stumbles as US yields eclipse fading October Fed hike bets6Circle says USDC settled $36T in H1 2026, revenue hits $1.4B7Bank of Korea: Policy patience case – Standard Chartered8EUR/USD Price Forecast: Recovery remains fragile below key moving averages9Bank of Canada: Inflation-growth tradeoff keeps policy on hold – RBC
LIVE QUOTES


ALL ABOUT TECHNICAL
What Is the Dark Cloud Cover Pattern and How Do You Trade It?
What Is the Piercing Line Candlestick Pattern and How Do You Trade It?
What Are Tweezer Top and Bottom Candlestick Patterns?
Inside Bar Candlestick Pattern: What It Is, How to Identify It, and How to Trade It
Hanging Man Candlestick Pattern: How to Identify and Trade It
How to Draw Fibonacci Retracement: Mastering the Golden Ratio in Trading
What is MACD & How to Identify Entry & Exit Points
What is the Relative Strength Index (RSI)
What is Scalping in Trading & How Does It Work
Get Started!
Sign up and access the Global Markets in less than 3 minutes

Connect With Us












The information provided on this website is of a general nature only and does not constitute personal financial advice. Before acting on any information on this website, you should consider the suitability of the information in relation to your objectives, financial situation and needs. Investing in CFDs and FX Margin Contracts carries significant risks and is not suitable for all investors. You may lose more than your initial deposit. You do not own, or have, any interest in the underlying asset. We recommend that you seek independent advice and ensure you fully understand the risks involved before trading. It is important that you read and consider the disclosure document before you acquire any product listed on the website. The information and advertisements offered on this website are not intended for use by any person in any country or jurisdiction where such use would be contrary to local laws and regulations. The Products and Services offered on this website are not intended for residents of the United States, Malaysia and Thailand.
TMGM is authorized and regulated in various jurisdictions.
Trademax Australia Limited, trading as TMGM, is regulated by the Australian Securities and Investments Commission (ASIC), AFSL no. 436416 and is located at Level 28, One International Tower, 100 Barangaroo Avenue, 2000 Sydney, NSW Australia.
Email: [email protected]
Trademax Global Limited, trading as TMGM, is authorized and regulated by the Vanuatu Financial Services Commission (VFSC), registration number 40356 and registered at 1276, Kumul Highway, Port Vila, Vanuatu, Republic of Vanuatu.
Email: [email protected]
Trademax Global Markets (SE) Limited, trading as TMGM, is authorized and regulated by the Financial Services Authority (FSA) of Seychelles, with license number SD224. The company is registered at Office No 13, Providence Estate ABIS Centre, Mahe, Seychelles.
Email: [email protected]
Trademax Global Markets (International) Pty Ltd, trading as TMGM, is authorized and regulated by the Financial Services Commission, Mauritius (FSC) with license no. GB22201012, and registered at 33, Edith Cavell Street C/o IQ EQ Fund Services (Mauritius) Ltd Port Louis, 11324 Mauritius.
Email: [email protected]
Copyright © TMGM. All rights reserved