

Trading
Explora una amplia gama de mercados con precios competitivos, liquidez profunda y herramientas de trading avanzadas.
Más información 
Plataforma
Opera sin interrupciones con la potente plataforma de TMGM, diseñada para ofrecer velocidad, precisión y una experiencia de trading superior.
Más información Plataforma de trading
Herramientas de trading
Academia
Aprende los fundamentos del trading con recursos ideales para principiantes, incluidas guías, seminarios web y análisis del mercado.
Más información Academia TMGM
Noticias y análisis
Obtén actualizaciones del mercado en tiempo real y análisis de expertos para adelantarte a las oportunidades de trading
Más información Noticias y análisis
Acerca de
Descubre qué distingue a TMGM: nuestra presencia global, solidez regulatoria y compromiso con la innovación en el trading.
Más información Por qué elegir TMGM
Australian Dollar tests 200-day SMA amid soaring US yields
- AUD/USD slides toward 200-day SMA after three straight declines.
- US 10-year yield tops 5.20% as Fed hike bets build.
- RBA hike expectations offer support ahead of September decision.
The Aussie Dollar fell for the third straight day, down 0.37% against the US Dollar, which remained boosted by elevated US yields, which jumped as Oil prices rose and as inflation pressures built. The AUD/USD trades at 0.7012, near the 200-day Simple Moving Average (SMA) of 0.7021.
AUD/USD tests major support as Fed tightening bets strengthen Dollar

US equity markets ended Thursday’s session in the red as sentiment deteriorated. The US Dollar extended its gains for the fourth consecutive day amid the lack of tangible progress in negotiations between the US and Iran. At the same time, crude Oil rose nearly 1.90%, with West Texas Intermediate trading at $93.21, recovering some ground despite reports that Tehran is eyeing a potential deal with Washington.
The story of the week is about US Treasury yields. The 10-year yield finished the day at 5.208%, up almost 10 basis points, as investors increased their hawkish bets on the Fed. Money markets had priced in a 68% chance of a rate hike in October and a 94% chance of another raise in December.
Housing data in the US revealed that New Home Sales in August bounced 6.4% MoM, after dropping -4.3% in the previous month. Jobs data was also featured, with Initial Jobless Claims for the week ending September 19 at 197K, below the previous week's reading of 198K and forecasts of 201K.
Fed speaking dominated the headlines, providing direction to the financial markets. New York Fed's John Williams suggested another rate hike this year, aligning with Philadelphia Fed's Anna Paulson, who said “more rate hikes may be needed” to curb inflation. Beth Hammack of the Cleveland Fed warned inflation pressures are rising, reaffirming her hawkish stance.
Regarding the encounter between China’s President Xi and US President Trump, both presidents exchanged conciliatory remarks and are seeking further cooperation, whether on trade or AI.
In Australia, the schedule is absent, yet traders' eyes are on the Reserve Bank of Australia (RBA) monetary policy decision on September 29. Data from Prime Terminal shows a 93% chance of a 25-basis-point rate increase to 4.60%. Besides this, Australia’s inflation data is expected in September 30..
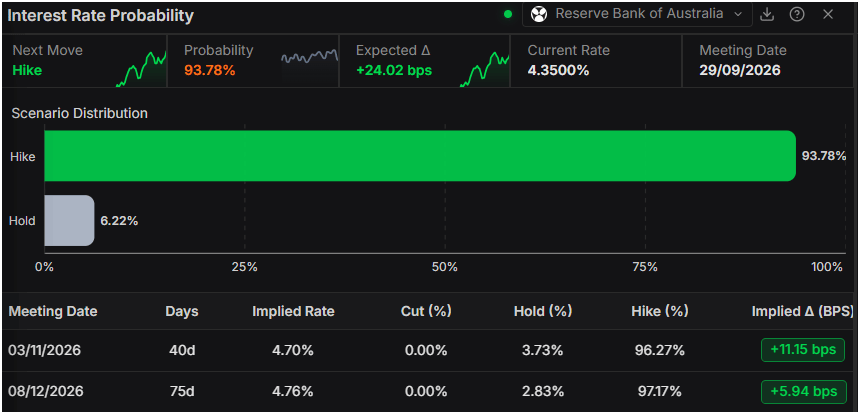
In the US, Durable Goods Orders and Consumer Sentiment are released on September 25, ahead of next Friday's Nonfarm Payrolls report.
AUD/USD Price Forecast: Technical outlook
In the daily chart, AUD/USD trades at 0.7010, extending a bearish near-term bias as spot holds under the cluster of simple moving averages (SMA) around 0.7092 and beneath multiple upward trend-line break levels at 0.7039 and higher. Price trades only modestly above the nearer structural support trend line at 0.6906, while the Relative Strength Index (14) at 32.37 hovers just above oversold territory, suggesting selling pressure persists but may be losing intensity.
On the topside, initial resistance emerges at the upward support trend-line break near 0.7039, followed by the grouped 50/100/200-day SMA area around 0.7092, with a horizontal barrier at 0.7198 capping the broader recovery attempts; farther up, former support trend lines turning resistance at 0.7385, 0.8716 and 0.9569 mark deeper upside hurdles. On the downside, the only nearby structural support sits at the upward trend line break around 0.6906, where a clear violation would open the door to an extension of the current bearish phase.
(The technical analysis of this story was written with the help of an AI tool. Know more.)
Artículos destacados
1Crypto exchange Bitget hacked for over $350 million2Gold declines below $4,300 as rising oil prices and hawkish Fed stance dampen appeal3Federal Reserve seeks public input on two stablecoin proposals under GENIUS Act4Japanese Yen keeps sliding as Tokyo repeats its warning and holds fire5Australian Dollar tests 200-day SMA amid soaring US yields6Mexican Peso : Range view with downside risks against US Dollar – Rabobank7New Zealand Dollar grinds lower as US bond yields climb to new highs8Dow Jones Industrial Average falls a third day as bond yields climb9Pound Sterling slides again as Fed speakers line up behind another hike
COTIZACIONES EN VIVO


¡Comience ahora!
Regístrese y acceda a los mercados globales en menos de 3 minutos

Conéctese con nosotros












La información proporcionada en este sitio web es únicamente de carácter general y no constituye asesoramiento financiero personal. Antes de actuar sobre cualquier información de este sitio web, debe considerar la idoneidad de la información en relación con sus objetivos, situación financiera y necesidades. Invertir en CFD y contratos de margen de FX conlleva riesgos significativos y no es adecuado para todos los inversores. Puede perder más que su depósito inicial. Usted no posee ni tiene ningún interés en el activo subyacente. Le recomendamos que busque asesoramiento independiente y se asegure de comprender plenamente los riesgos involucrados antes de operar. Es importante que lea y considere el documento de divulgación antes de adquirir cualquier producto listado en el sitio web. La información y los anuncios ofrecidos en este sitio web no están destinados al uso por parte de ninguna persona en ningún país o jurisdicción donde dicho uso sea contrario a las leyes y regulaciones locales. Los productos y servicios ofrecidos en este sitio web no están destinados a residentes de Estados Unidos, Malasia y Tailandia.
TMGM está autorizado y regulado en varias jurisdicciones.
Trademax Australia Limited, que opera como TMGM, está regulada por la Comisión Australiana de Valores e Inversiones (ASIC), AFSL n.º 436416, y está ubicada en Level 28, One International Tower, 100 Barangaroo Avenue, 2000 Sydney, NSW Australia.
Correo electrónico: [email protected]
Trademax Global Limited, que opera como TMGM, está autorizada y regulada por la Comisión de Servicios Financieros de Vanuatu (VFSC), número de registro 40356, y está registrada en 1276, Kumul Highway, Port Vila, Vanuatu, República de Vanuatu.
Correo electrónico: [email protected]
Trademax Global Markets (SE) Limited, que opera como TMGM, está autorizada y regulada por la Autoridad de Servicios Financieros (FSA) de Seychelles, con número de licencia SD224. La empresa está registrada en Office No 13, Providence Estate ABIS Centre, Mahe, Seychelles.
Correo electrónico: [email protected]
Trademax Global Markets (International) Pty Ltd, que opera como TMGM, está autorizada y regulada por la Comisión de Servicios Financieros de Mauricio (FSC) con licencia n.º GB22201012, y está registrada en 33, Edith Cavell Street C/o IQ EQ Fund Services (Mauritius) Ltd Port Louis, 11324 Mauricio.
Correo electrónico: [email protected]
Copyright © TMGM. Todos los derechos reservados