

Ripple Price Forecast: XRP bulls tighten grip, raising $1.50 breakout odds
- XRP builds momentum for the second consecutive day, trading above $1.42.
- Capital inflows into US-listed XRP spot ETFs and perpetual futures Open Interest mildly return, backing recovery outlook.
- XRP maintains a neutral-to-bullish technical outlook, with momentum indicators stabilizing.
Ripple (XRP) ticks higher, trading at $1.42 on Wednesday while building on a recently confirmed support range between $1.30 and $1.35. The token also sits above major moving averages, reinforcing the bullish outlook. However, upside could remain capped unless the psychological barriers at $1.50 and $1.70 are cleared, paving the way for an extended recovery above $2.00.

XRP capital inflows return
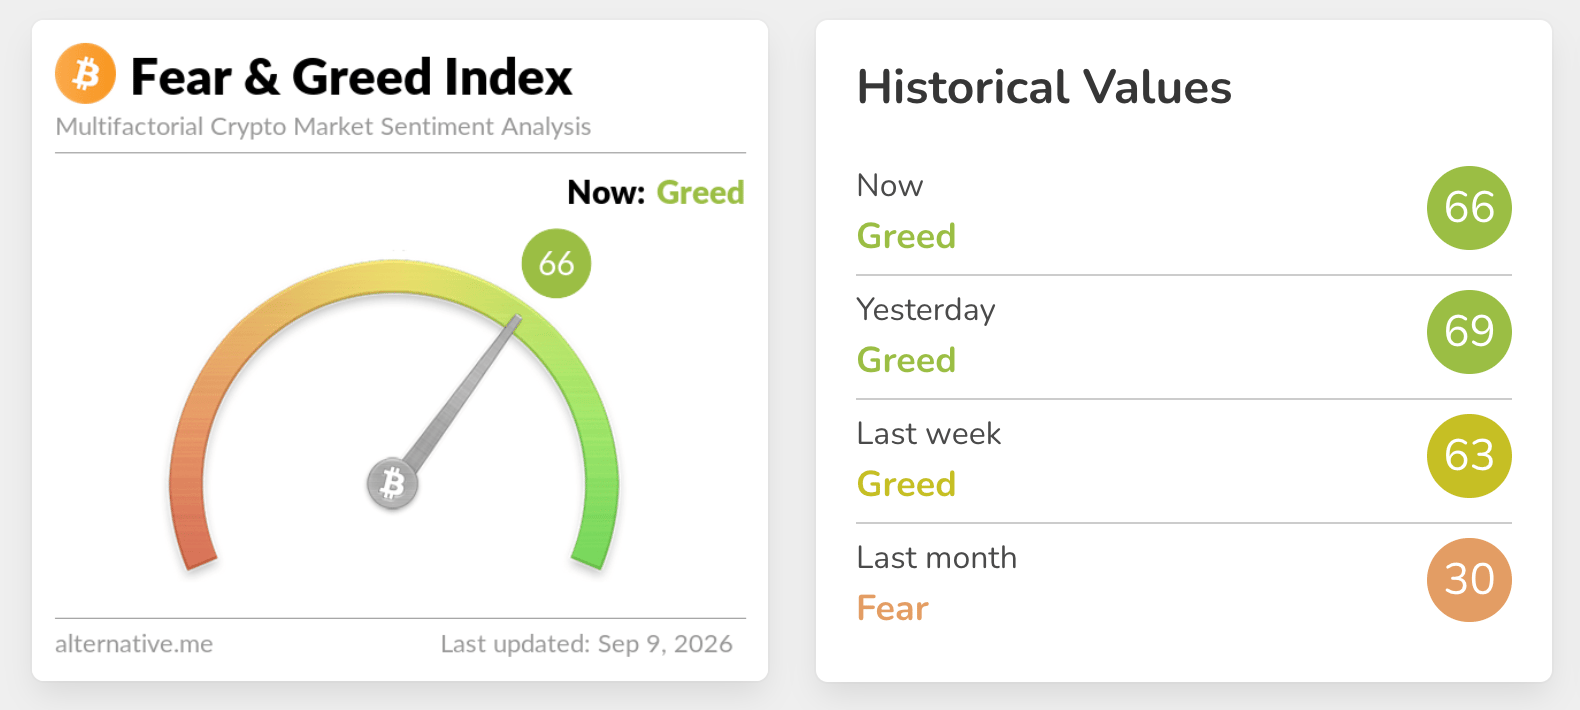
Demand for digital assets has remained relatively elevated since the August rally, aligning with the crypto Fear & Greed Index, which holds at 66 in the Greed territory on Wednesday, down only slightly from 69 the previous day. This setup shows steady risk-on sentiment, which is required to sustain demand and improve the XRP breakout prospects.
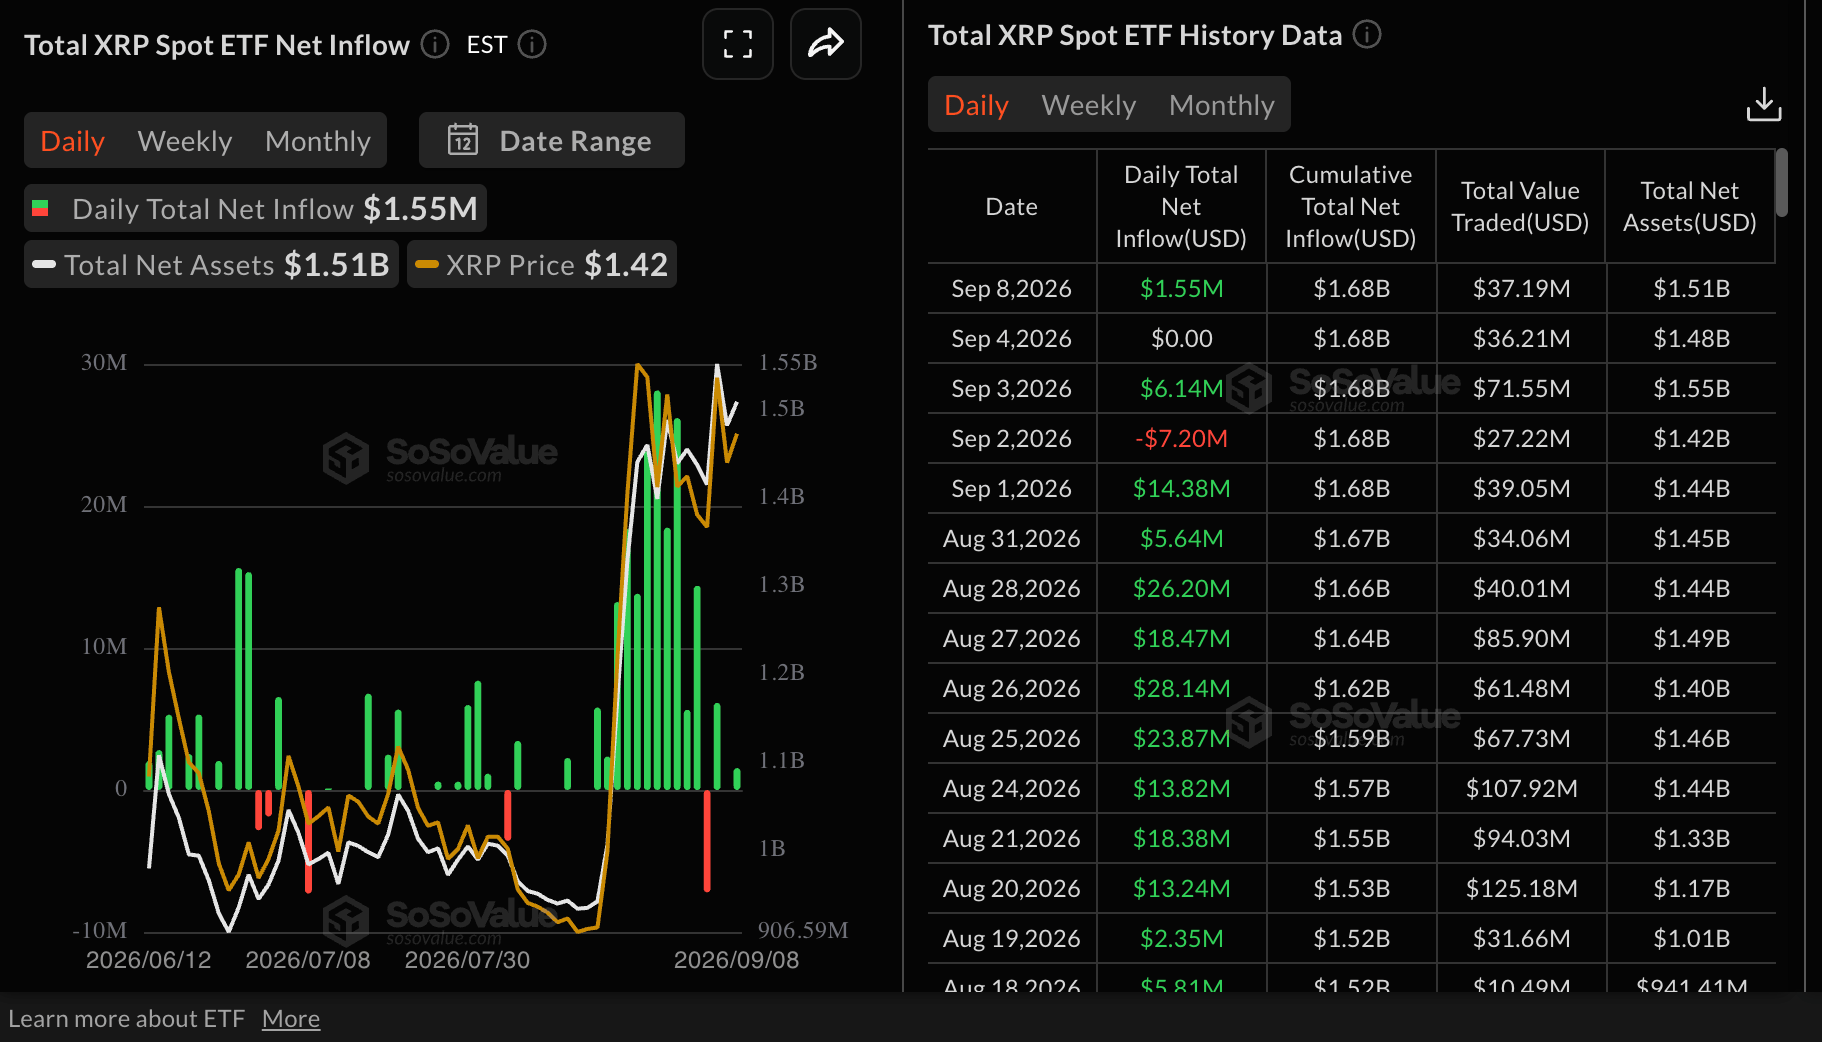
XRP spot Exchange-Traded Funds (ETFs) saw the return of inflows amounting to $1.55 billion on Tuesday following a brief hiatus. This brought cumulative inflows to $1.68 billion, with net assets under management holding at $1 0.51 billion. An increase in ETF inflows could help boost the token’s short-term outlook, cushioning the price from headwinds caused by macroeconomic uncertainty and growing geopolitical tensions in the Middle East.
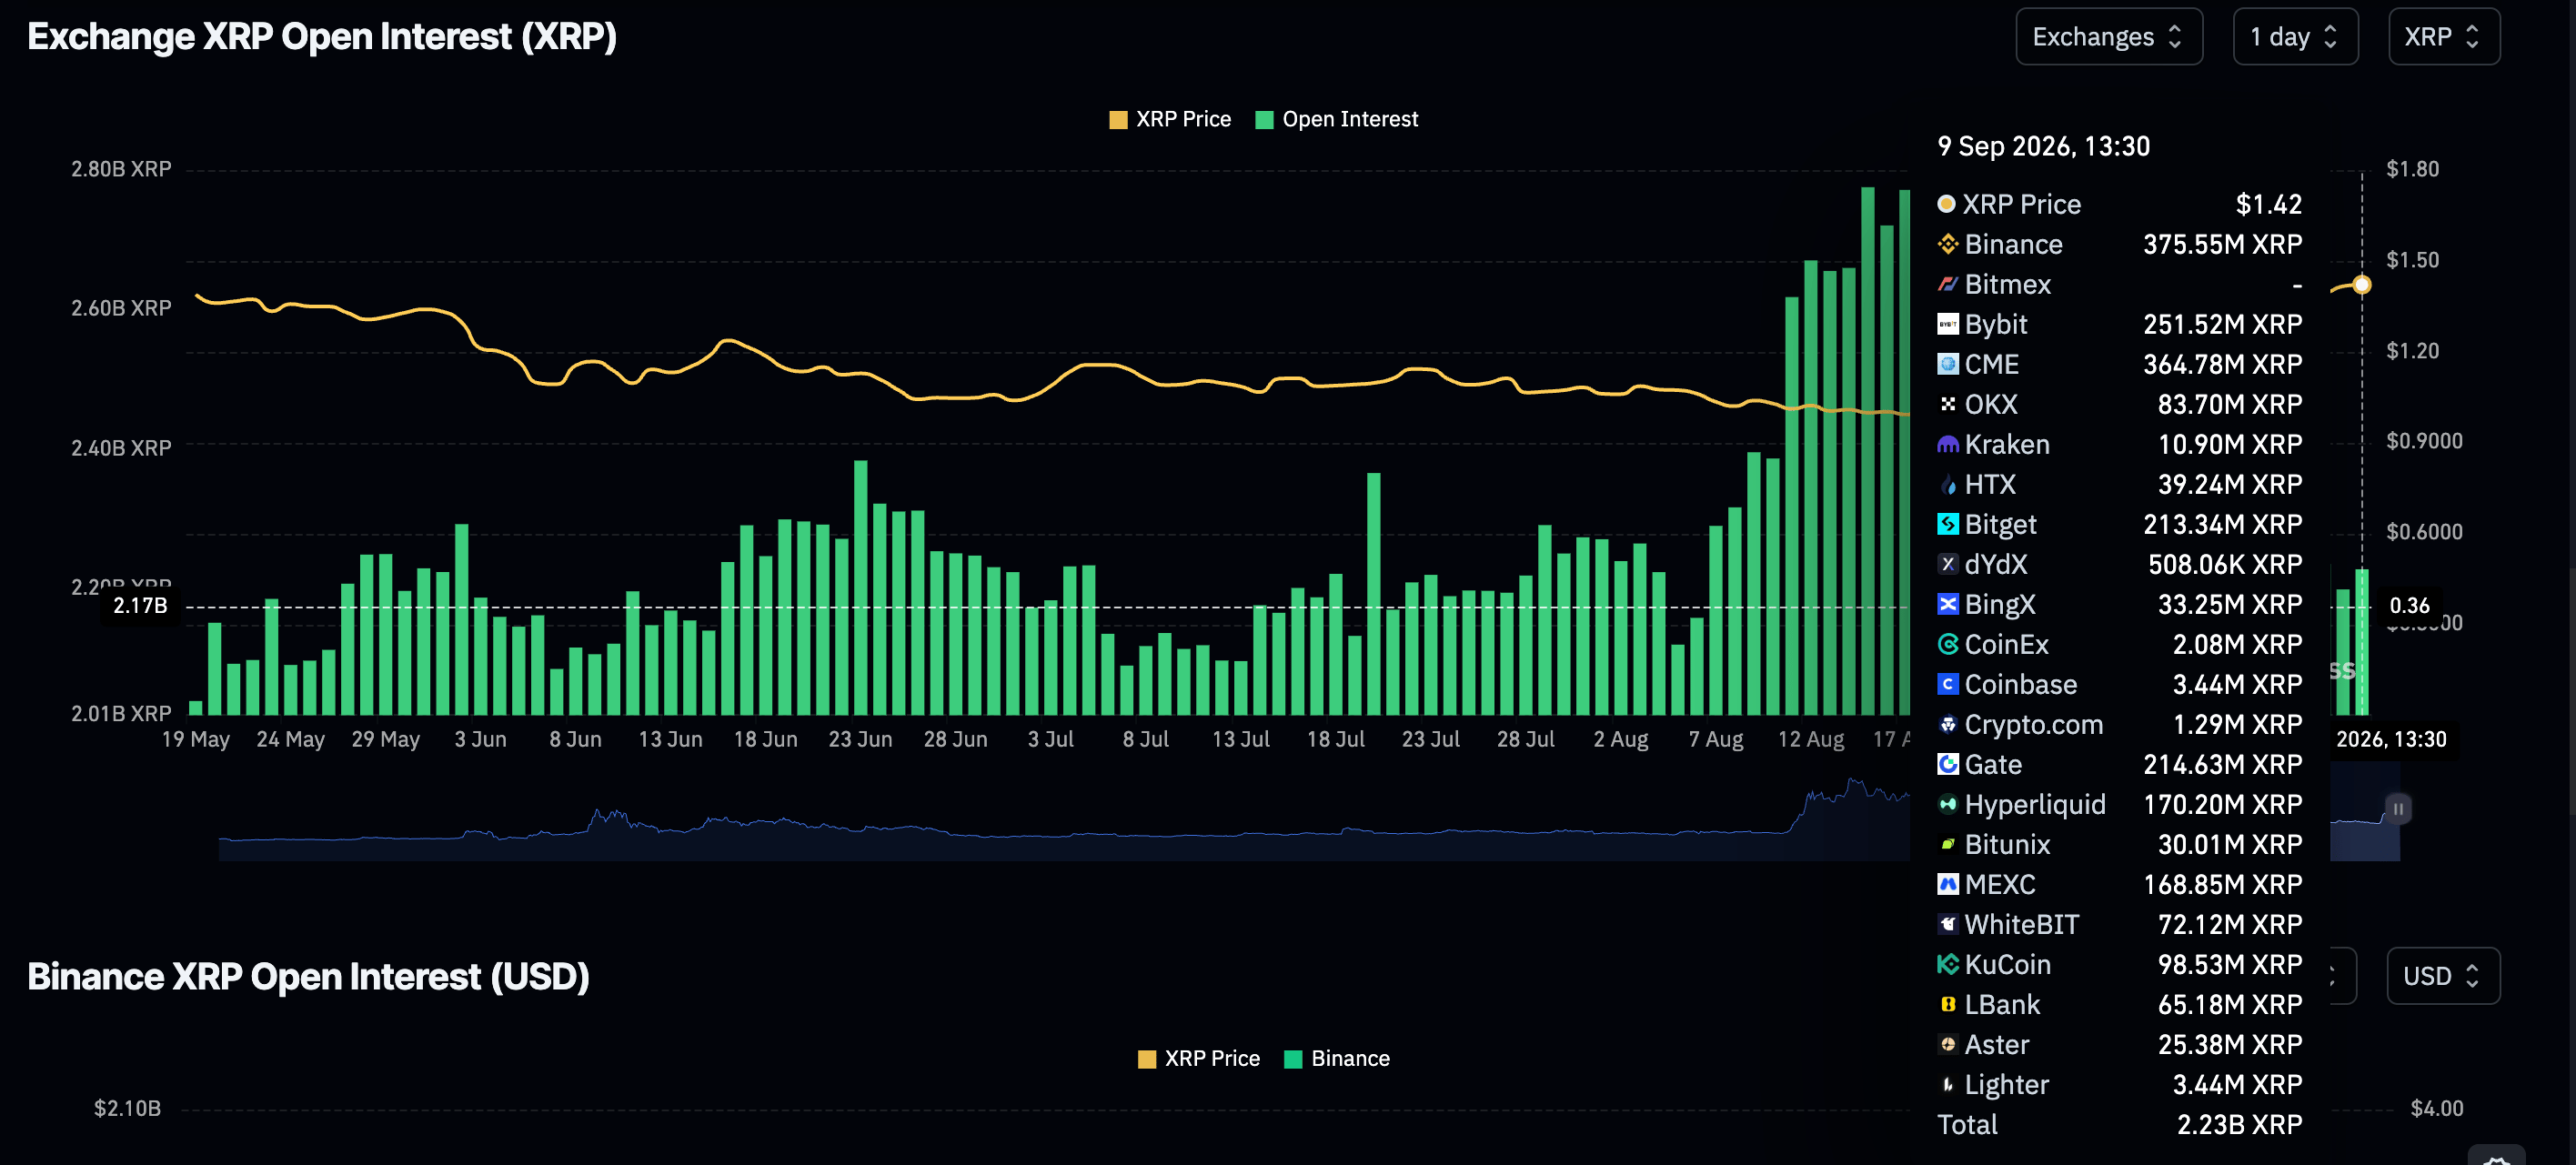
Meanwhile, retail demand stands relatively steady with perpetual futures Open Interest (OI) at 2.23 billion XRP on Wednesday, down only marginally from 2.24 billion XRP the previous day. Despite the stability, OI remains well below August’s peak of 2.78 billion. A steady recovery is required to support XRP’s uptrend in the short to medium term.
Technical analysis: XRP consolidates as bulls return
XRP is trading above $1.42, holding a bullish near‑term bias as price stands well above the 50‑day and 100‑day Exponential Moving Averages (EMAs) at $1.27 and $1.24, respectively. This configuration suggests the broader upswing remains intact despite a recent pullback from the highs, while the Relative Strength Index (RSI) around 61 hints at still‑constructive, though moderating, upside momentum.
Meanwhile, the negative Moving Average Convergence Divergence (MACD) reading, however, warns that bullish pressure is not as strong as it was during the earlier spike.
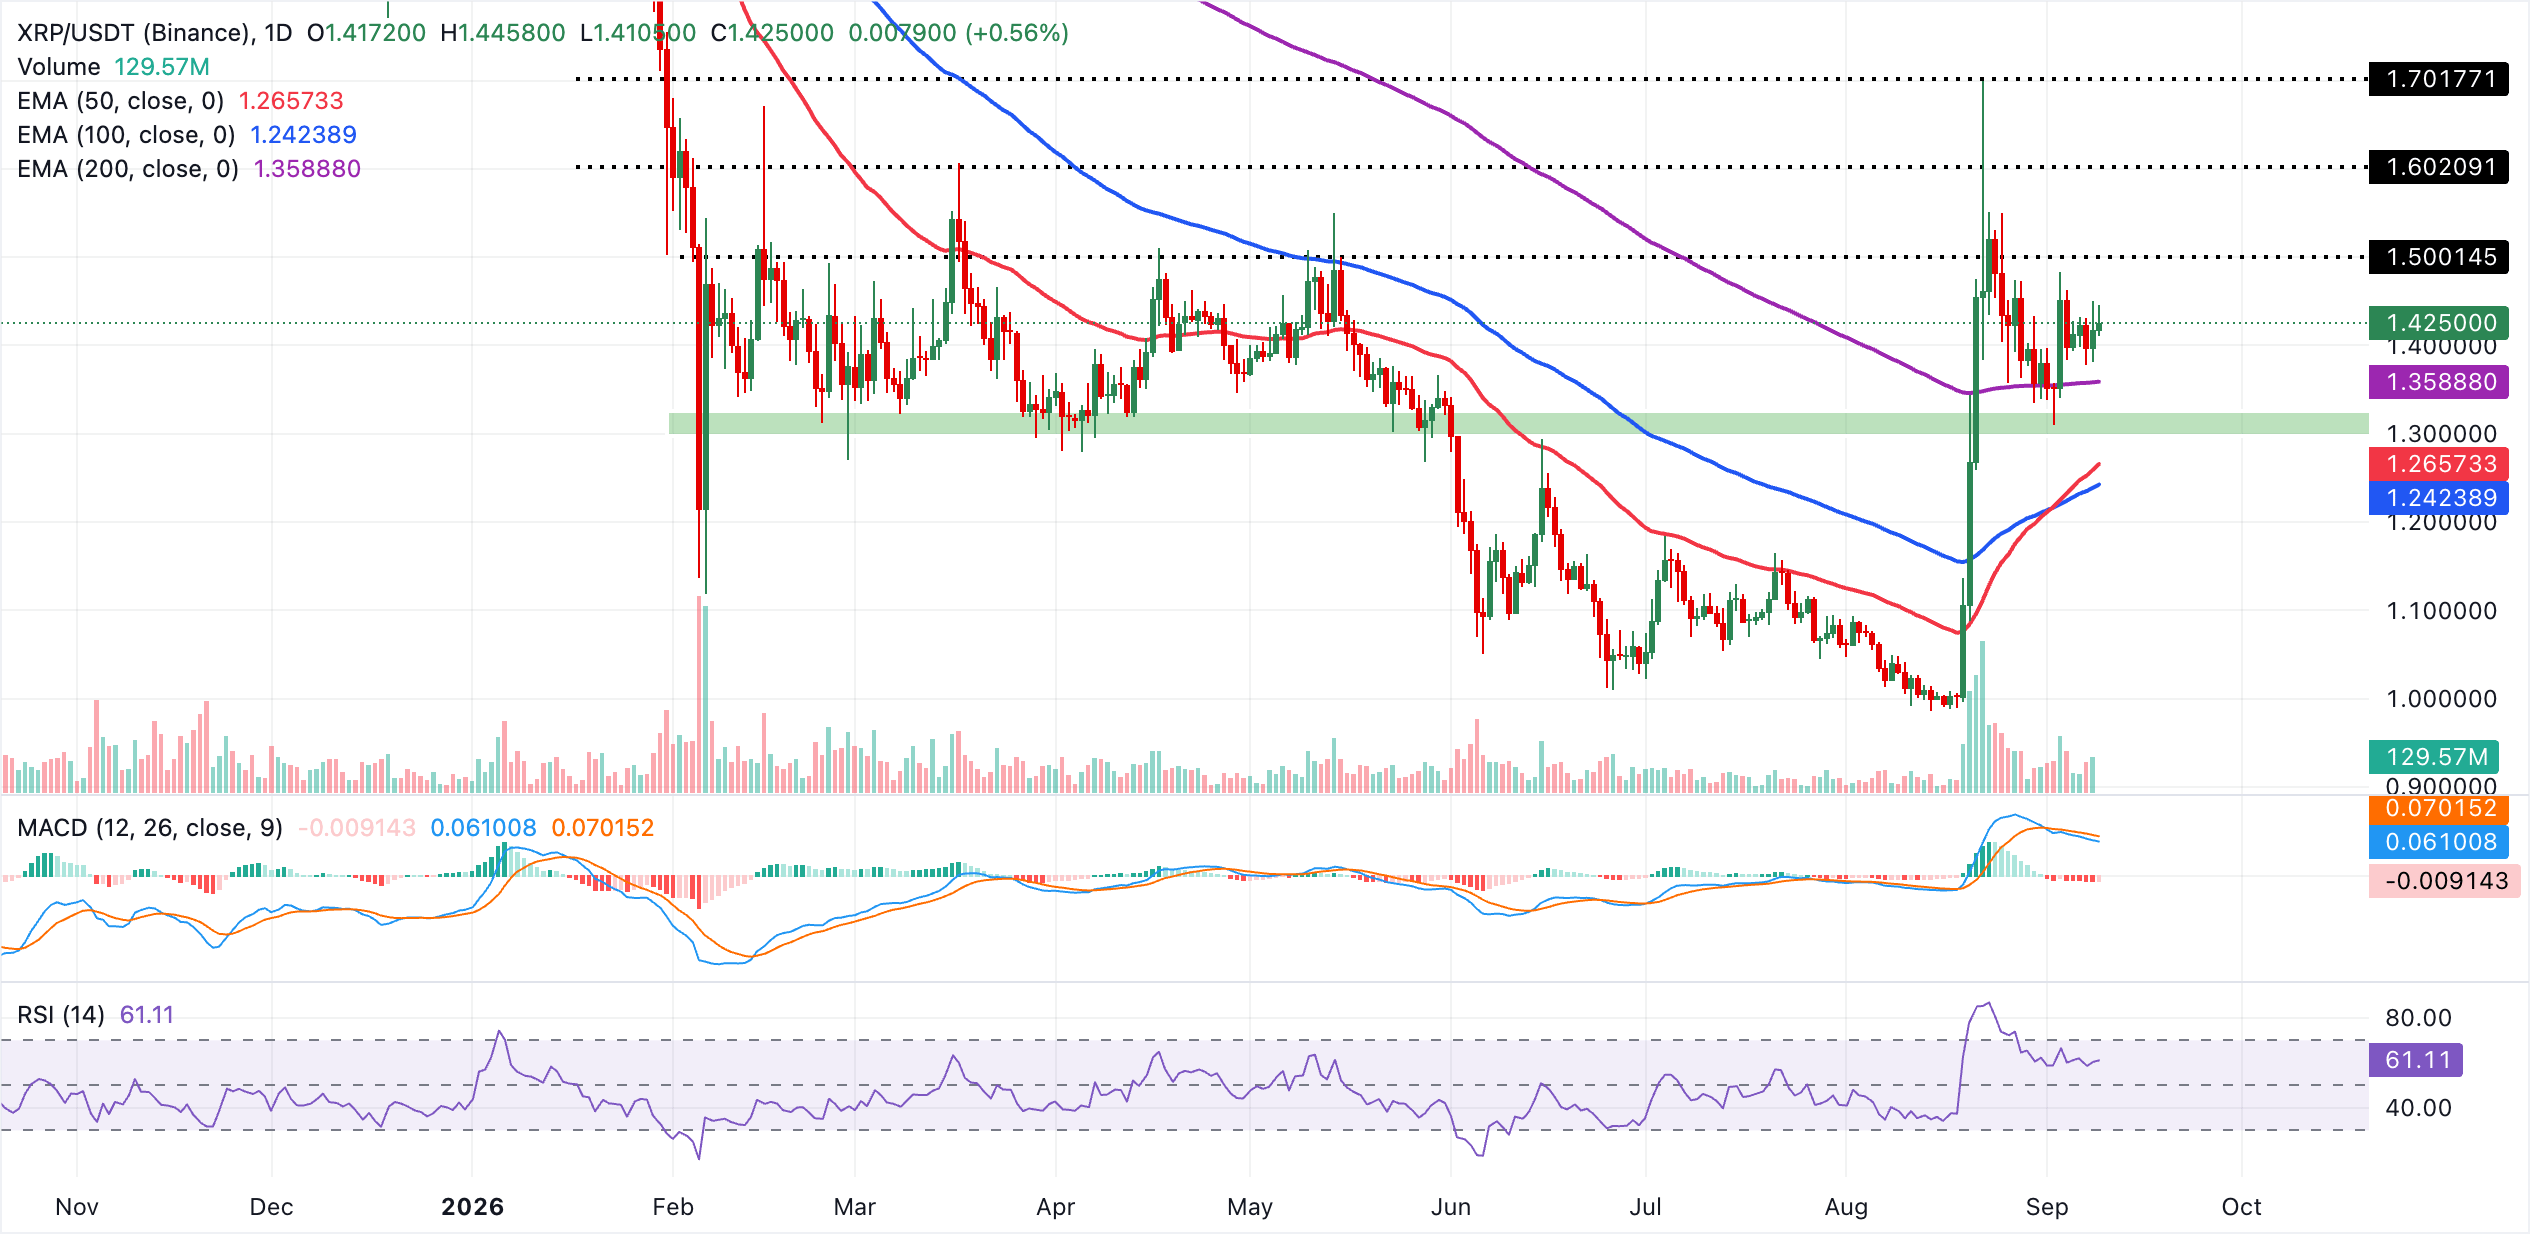
On the downside, initial support is seen at the 50‑day EMA near $1.27, with the 100‑day EMA around $1.24 providing a secondary cushion if selling deepens. On the topside, the 200‑day EMA at $1.36 is the next important resistance to watch. A sustained break above this longer‑term average would likely reopen the path toward the recent highs, whereas failure to reclaim it could keep XRP consolidating or correcting back toward the EMA support band.
(The technical analysis of this story was written with the help of an AI tool. Know more.)
Open Interest, funding rate FAQs
Higher Open Interest is associated with higher liquidity and new capital inflow to the market. This is considered the equivalent of increase in efficiency and the ongoing trend continues. When Open Interest decreases, it is considered a sign of liquidation in the market, investors are leaving and the overall demand for an asset is on a decline, fueling a bearish sentiment among investors.
Funding fees bridge the difference between spot prices and prices of futures contracts of an asset by increasing liquidation risks faced by traders. A consistently high and positive funding rate implies there is a bullish sentiment among market participants and there is an expectation of a price hike. A consistently negative funding rate for an asset implies a bearish sentiment, indicating that traders expect the cryptocurrency’s price to fall and a bearish trend reversal is likely to occur.














