

Trading
Explorez une large gamme de marchés avec des prix compétitifs, une liquidité profonde et des outils de trading avancés.
En savoir plus 
Plateforme
Tradez en toute fluidité avec la plateforme puissante de TMGM, conçue pour la vitesse, la précision et une expérience de trading supérieure.
En savoir plus Plateforme de trading
Outils de trading
Académie
Apprenez les fondamentaux du trading avec des ressources adaptées aux débutants, incluant des guides, des webinaires et des analyses de marché.
En savoir plus Actualités et analyses
Obtenez des mises à jour de marché en temps réel et des analyses d'experts pour anticiper les opportunités de trading
En savoir plus Actualités et analyses
À propos
Découvrez ce qui distingue TMGM — notre présence mondiale, notre solidité réglementaire et notre engagement envers l'innovation dans le trading.
En savoir plus Pourquoi choisir TMGM
The New Zealand Dollar extends its slide as the US Dollar hits a yearly high
- NZD/USD extends its slide under 0.5600, its lowest since November 2025, as the Dollar hits a yearly high.
- Sixth straight weekly loss on track, from just under 0.6000 in late August.
- RBNZ cash rate at 2.75%, up from 2.25% after its last cut in November 2025.
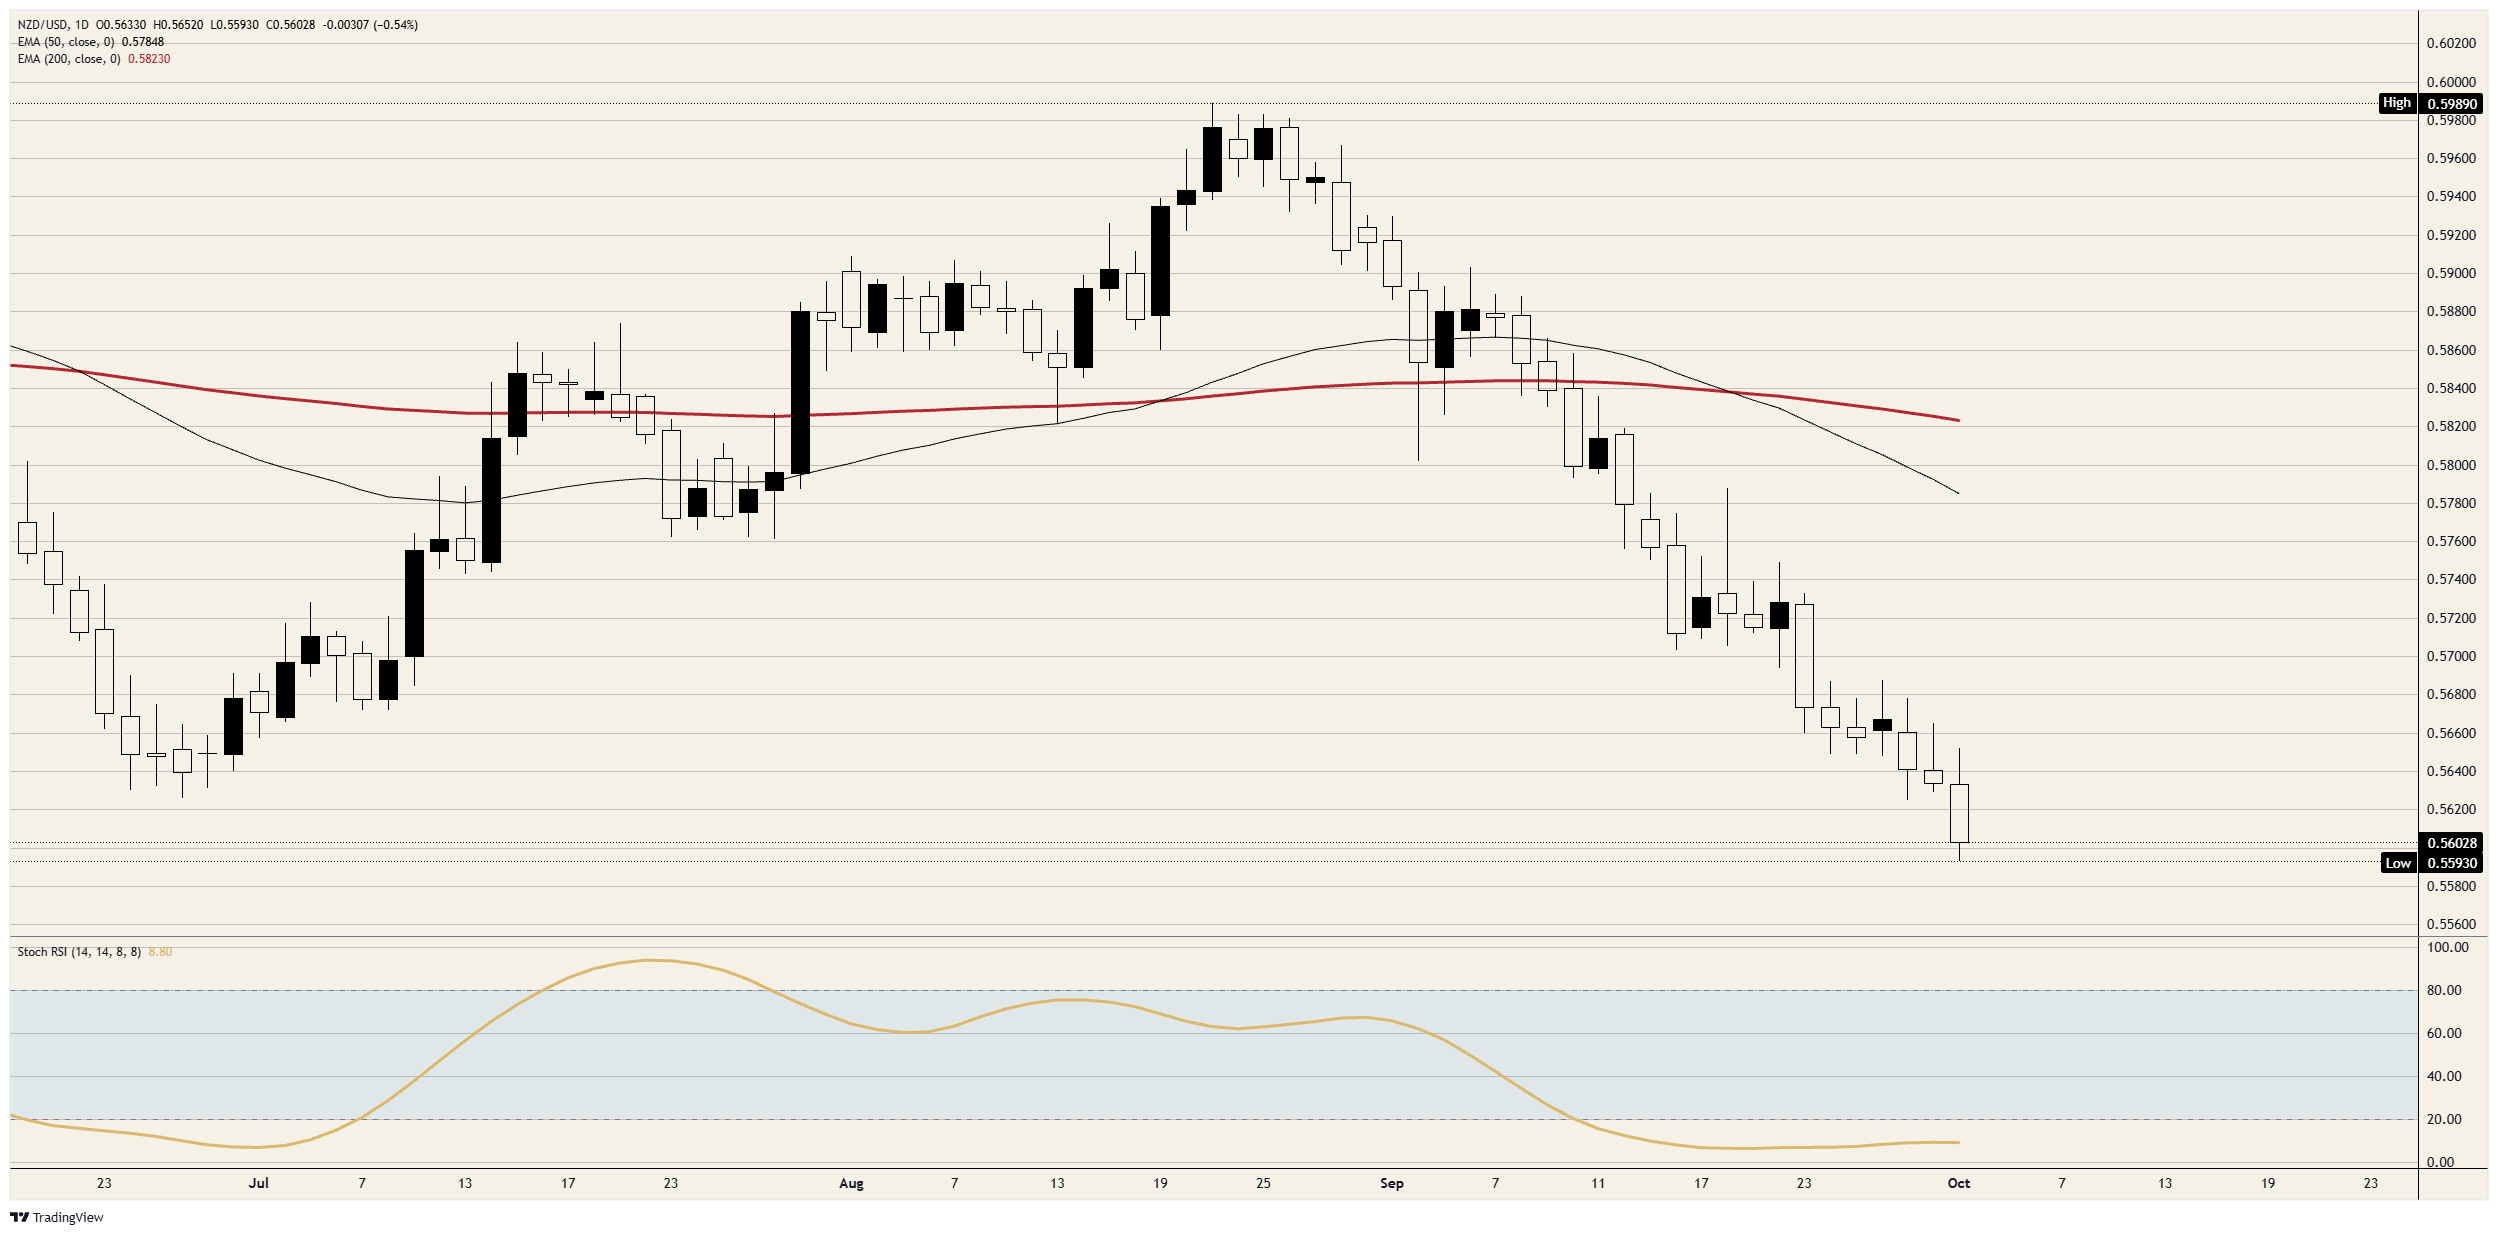
Five losing weeks in a row and most of a sixth have taken NZD/USD to its lowest since the Reserve Bank of New Zealand (RBNZ) last cut rates, in November 2025. The RBNZ has raised its rate twice since, to 2.75%, and traders have built up bets on a third hike on October 28. NZD/USD trades just above 0.5600 and is down for a third session running.

The Fed's range is back where it was in November 2025, and so is the Kiwi
The Fed's range is 3.75%-4.00% after its September 16 hike, the same as in November 2025. The RBNZ's Official Cash Rate (OCR) is a quarter-point above where it stood before its November 2025 cut. The gap between the two policy rates is narrower than the last time NZD/USD traded this low.
What has changed is longer-term US borrowing costs, with the 10-year Treasury yield at its highest since 2002 on Thursday. The RBNZ may yet hike a third time on October 28, and the two hikes before it have left the Kiwi where it started.
Soft US data hasn't been enough to lift the Kiwi
US payrolls on Friday at 12:30 GMT are the next scheduled test for NZD/USD, with 90K jobs forecast after August's 162K. New Zealand's next release is third-quarter business confidence from the New Zealand Institute of Economic Research (NZIER), due on Monday at 21:00 GMT and last at 8%. China, New Zealand's largest export market, is on holiday until October 7.
Softer US inflation figures on Wednesday didn't stop NZD/USD falling that day. The 90K payroll forecast already describes a slowing job market, so a weak count would be the expected result rather than news.
The New Zealand Dollar's levels and bias
Resistance: 0.5650 kept Tuesday's and Wednesday's daily closes below it, near where the week opened, and every session since September 23 has peaked below 0.5700.
Support: The break under 0.5600 leaves Thursday's low just beneath it as the first marker, then 0.5550 and 0.5500.
Bias: The tape stays offered below 0.5650 on a closing basis, with 0.5550 the first objective and 0.5500 the second. The daily Stochastic Relative Strength Index (Stoch RSI) is near 9, roughly where it has been since mid-September, so the slide is old without having turned. A daily close above 0.5700 cancels the short.
NZD/USD daily chart
New Zealand Dollar FAQs
The New Zealand Dollar (NZD), also known as the Kiwi, is a well-known traded currency among investors. Its value is broadly determined by the health of the New Zealand economy and the country’s central bank policy. Still, there are some unique particularities that also can make NZD move. The performance of the Chinese economy tends to move the Kiwi because China is New Zealand’s biggest trading partner. Bad news for the Chinese economy likely means less New Zealand exports to the country, hitting the economy and thus its currency. Another factor moving NZD is dairy prices as the dairy industry is New Zealand’s main export. High dairy prices boost export income, contributing positively to the economy and thus to the NZD.
The Reserve Bank of New Zealand (RBNZ) aims to achieve and maintain an inflation rate between 1% and 3% over the medium term, with a focus to keep it near the 2% mid-point. To this end, the bank sets an appropriate level of interest rates. When inflation is too high, the RBNZ will increase interest rates to cool the economy, but the move will also make bond yields higher, increasing investors’ appeal to invest in the country and thus boosting NZD. On the contrary, lower interest rates tend to weaken NZD. The so-called rate differential, or how rates in New Zealand are or are expected to be compared to the ones set by the US Federal Reserve, can also play a key role in moving the NZD/USD pair.
Macroeconomic data releases in New Zealand are key to assess the state of the economy and can impact the New Zealand Dollar’s (NZD) valuation. A strong economy, based on high economic growth, low unemployment and high confidence is good for NZD. High economic growth attracts foreign investment and may encourage the Reserve Bank of New Zealand to increase interest rates, if this economic strength comes together with elevated inflation. Conversely, if economic data is weak, NZD is likely to depreciate.
The New Zealand Dollar (NZD) tends to strengthen during risk-on periods, or when investors perceive that broader market risks are low and are optimistic about growth. This tends to lead to a more favorable outlook for commodities and so-called ‘commodity currencies’ such as the Kiwi. Conversely, NZD tends to weaken at times of market turbulence or economic uncertainty as investors tend to sell higher-risk assets and flee to the more-stable safe havens.
ARTICLES POPULAIRES
1Gold recovers above $4,150 as US yields retreat ahead of US September jobs data2Tokyo core inflation hits 2.7% and the Yen firms3Fed’s Logan: Policy rate must increase by additional 50 bps or more42.7%: Japan’s Tokyo CPI inflation climbs in September5Australian Dollar drifts toward 0.69 as USD shrugs off Fed patience6The Japanese Yen weakens as traders pare Bank of Japan October hike bets7The New Zealand Dollar extends its slide as the US Dollar hits a yearly high8The Euro sells off hard as the French-German bond gap widens9The British Pound slides again as UK government bonds sell off
COTATIONS EN DIRECT

TOUT SUR FOREX
Commencez !
Inscrivez-vous et accédez aux Marchés Mondiaux en moins de 3 minutes

Connectez-vous avec Nous












Les informations fournies sur ce site web sont de nature générale uniquement et ne constituent pas un conseil financier personnalisé. Avant d’agir sur la base de toute information figurant sur ce site web, vous devez évaluer la pertinence de ces informations au regard de vos objectifs, de votre situation financière et de vos besoins. Investir dans les CFD et les contrats de marge sur le Forex comporte des risques importants et ne convient pas à tous les investisseurs. Vous pouvez perdre plus que votre dépôt initial. Vous ne détenez pas, et n’avez, aucun droit de propriété ou intérêt sur l’actif sous-jacent. Nous vous recommandons de solliciter un avis indépendant et de vous assurer que vous comprenez pleinement les risques encourus avant de trader. Il est important que vous lisiez et preniez en considération le document d’information avant d’acquérir tout produit présenté sur le site web. Les informations et publicités proposées sur ce site web ne sont pas destinées à être utilisées par toute personne dans tout pays ou toute juridiction où une telle utilisation serait contraire aux lois et réglementations locales. Les Produits et Services proposés sur ce site web ne sont pas destinés aux résidents des États-Unis, de la Malaisie et de la Thaïlande.
TMGM est autorisé et réglementé dans diverses juridictions.
Trademax Australia Limited, opérant sous le nom de TMGM, est réglementé par l'Australian Securities and Investments Commission (ASIC), AFSL no. 436416 et est situé au Level 28, One International Tower, 100 Barangaroo Avenue, 2000 Sydney, NSW Australie.
Email: [email protected]
Trademax Global Limited, opérant sous le nom de TMGM, est autorisé et réglementé par la Vanuatu Financial Services Commission (VFSC), numéro d'enregistrement 40356 et enregistré au 1276, Kumul Highway, Port Vila, Vanuatu, République de Vanuatu.
Email: [email protected]
Trademax Global Markets (SE) Limited, exerçant sous le nom TMGM, est autorisée et régulée par la Financial Services Authority (FSA) des Seychelles, sous le numéro de licence SD224. La société est enregistrée au bureau n° 13, Providence Estate ABIS Centre, Mahé, Seychelles.
Email: [email protected]
Trademax Global Markets (International) Pty Ltd, opérant sous le nom de TMGM, est autorisé et réglementé par la Financial Services Commission, Maurice (FSC) avec la licence no. GB22201012, et enregistré au 33, Edith Cavell Street C/o IQ EQ Fund Services (Mauritius) Ltd Port Louis, 11324 Maurice.
Email: [email protected]
Copyright © TMGM. Tous droits réservés