

Trading
Tuklasin ang malawak na hanay ng mga merkado na may competitive na presyo, malalim na liquidity, at advanced na trading tools.
Matuto Pa 
Platform
Mag-trade nang walang sagabal gamit ang malakas na platform ng TMGM, na ginawa para sa bilis, katumpakan, at superior na trading experience.
Matuto Pa Trading Platform
Mga Trading Tools
Academy
Matuto ng mga pangunahing kaalaman sa trading gamit ang mga beginner-friendly na resources, kasama ang mga gabay, webinars, at market insights.
Matuto Pa TMGM Academy
Balita at Analysis
Makakuha ng real-time na mga update sa merkado at expert analysis upang manatiling nangunguna sa mga trading opportunities
Matuto Pa Balita at Analysis
Tungkol
Alamin kung ano ang nagpapangiiba sa TMGM — ang aming global presence, regulatory strength, at commitment sa innovation sa trading.
Matuto Pa Bakit Piliin ang TMGM
Sponsorship
102.00: United States Dollar Index skids below this level
- The US Dollar Index faces intense selling pressure in the aftermath of the US inflation data for September.
- Both US headline and core inflation figures rose at a faster-than-expected pace.
- The odds of the Fed hiking interest rates in October have increased marginally after the US CPI data release.
The US Dollar (USD) underperforms its major currency peers on Thursday as hot United States (US) Consumer Price Index (CPI) data for September has failed to bring a meaningful impact on Federal Reserve’s (Fed) interest rate expectations.

US Dollar Price Today
The table below shows the percentage change of US Dollar (USD) against listed major currencies today. US Dollar was the weakest against the Swiss Franc.
| USD | EUR | GBP | JPY | CAD | AUD | NZD | CHF | |
|---|---|---|---|---|---|---|---|---|
| USD | -0.61% | -0.43% | -0.39% | -0.23% | 0.22% | -0.58% | -0.76% | |
| EUR | 0.61% | 0.17% | 0.19% | 0.35% | 0.86% | 0.00% | -0.16% | |
| GBP | 0.43% | -0.17% | 0.02% | 0.18% | 0.65% | -0.16% | -0.34% | |
| JPY | 0.39% | -0.19% | -0.02% | 0.15% | 0.64% | -0.21% | -0.38% | |
| CAD | 0.23% | -0.35% | -0.18% | -0.15% | 0.46% | -0.34% | -0.53% | |
| AUD | -0.22% | -0.86% | -0.65% | -0.64% | -0.46% | -0.81% | -1.00% | |
| NZD | 0.58% | -0.01% | 0.16% | 0.21% | 0.34% | 0.81% | -0.19% | |
| CHF | 0.76% | 0.16% | 0.34% | 0.38% | 0.53% | 1.00% | 0.19% |
The heat map shows percentage changes of major currencies against each other. The base currency is picked from the left column, while the quote currency is picked from the top row. For example, if you pick the US Dollar from the left column and move along the horizontal line to the Japanese Yen, the percentage change displayed in the box will represent USD (base)/JPY (quote).
In the Asian trade, the US Dollar Index (DXY), which gauges the Greenback’s value against six major currencies, trades 0.6% lower to near 101.90. The DXY has retreated sharply from its 18-month high of 102.95 posted on Wednesday.
The US CPI report showed that both headline and core inflation accelerated at a faster-than-expected pace to 3.7% and 2.6%, respectively.
However, the follow-up impact of hot US CPI report on Fed’s monetary policy expectations appears to be limited. The CME FedWatch tool shows that the odds of the Fed hiking interest rates in the policy meeting later this meeting have increased marginally to 27% from 22% seen before the data release.
US Bond Yields are also facing significant selling pressure following the US inflation report release. Yields on 10-year US Treasuries have extended their correction to near 5.10%.
Later in the day, investors will focus on the US Producer Price Index (PPI) data for September, which will be published at 12:30 GMT.
US Dollar Index Technical Analysis
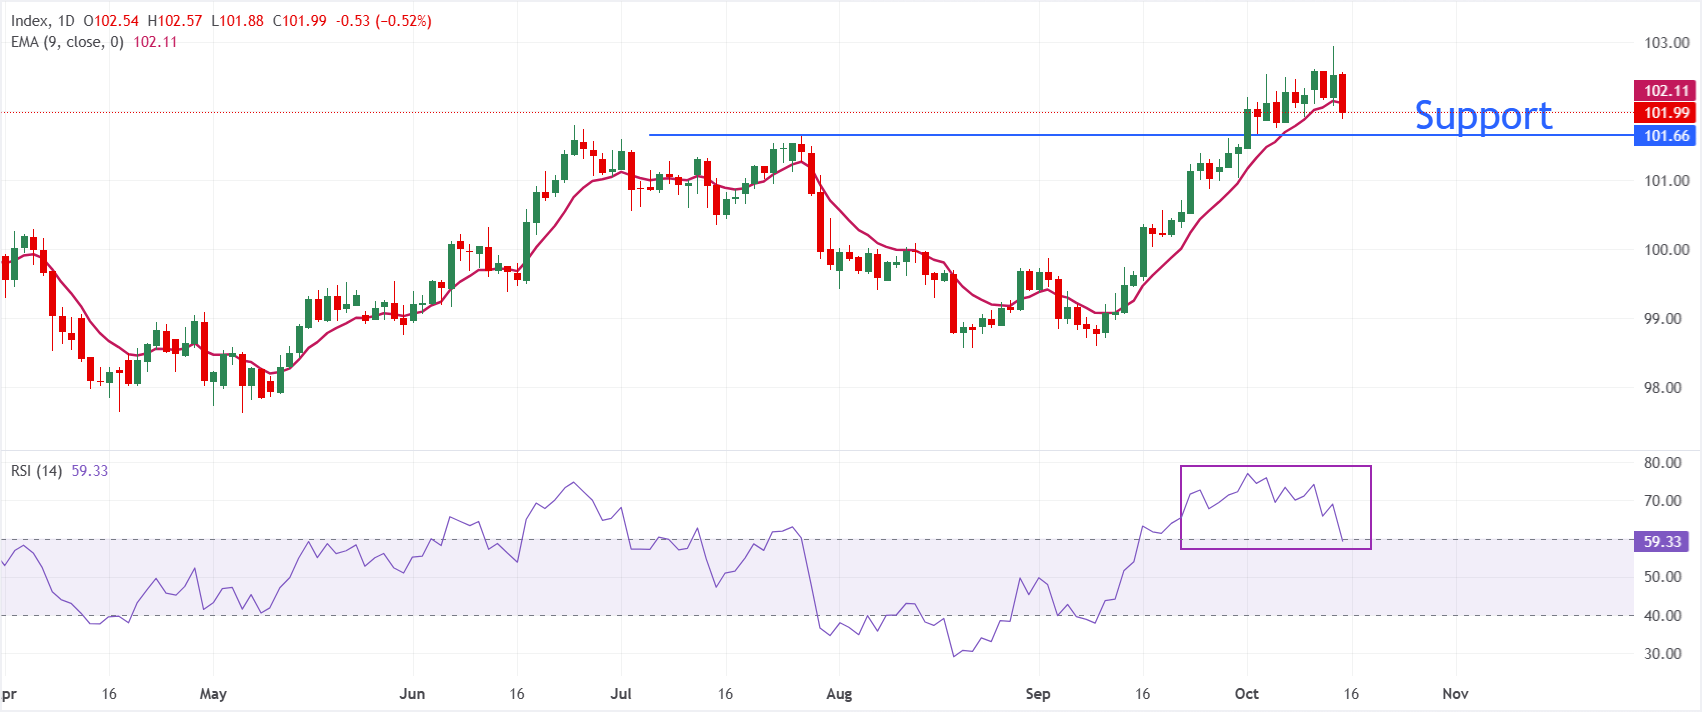
In the daily chart, Dollar Index Spot trades at 101.99, retaining a mildly bearish near-term bias as it holds beneath the 9-period exponential moving average (EMA) at 102.11. The short-term trend is capped by this nearby dynamic barrier, while the Relative Strength Index (RSI) at 59.31 shows positive but moderating momentum, hinting that bulls are losing some traction after the recent overbought readings seen earlier in the month.
On the topside, immediate resistance is located at the 9-period EMA near 102.11, and a sustained break above this level would ease the current downside pressure and open the way for a broader recovery phase. With no clear technical supports derived from the provided dataset, any pullbacks from current levels would likely be driven by momentum cooling rather than well-defined structural floors, leaving the index vulnerable to corrective dips while it remains capped below the short-term EMA.
(The technical analysis of this story was written with the help of an AI tool. Know more.)
US Dollar FAQs
The US Dollar (USD) is the official currency of the United States of America, and the ‘de facto’ currency of a significant number of other countries where it is found in circulation alongside local notes. It is the most heavily traded currency in the world, accounting for over 88% of all global foreign exchange turnover, or an average of $6.6 trillion in transactions per day, according to data from 2022. Following the second world war, the USD took over from the British Pound as the world’s reserve currency. For most of its history, the US Dollar was backed by Gold, until the Bretton Woods Agreement in 1971 when the Gold Standard went away.
The most important single factor impacting on the value of the US Dollar is monetary policy, which is shaped by the Federal Reserve (Fed). The Fed has two mandates: to achieve price stability (control inflation) and foster full employment. Its primary tool to achieve these two goals is by adjusting interest rates. When prices are rising too quickly and inflation is above the Fed’s 2% target, the Fed will raise rates, which helps the USD value. When inflation falls below 2% or the Unemployment Rate is too high, the Fed may lower interest rates, which weighs on the Greenback.
In extreme situations, the Federal Reserve can also print more Dollars and enact quantitative easing (QE). QE is the process by which the Fed substantially increases the flow of credit in a stuck financial system. It is a non-standard policy measure used when credit has dried up because banks will not lend to each other (out of the fear of counterparty default). It is a last resort when simply lowering interest rates is unlikely to achieve the necessary result. It was the Fed’s weapon of choice to combat the credit crunch that occurred during the Great Financial Crisis in 2008. It involves the Fed printing more Dollars and using them to buy US government bonds predominantly from financial institutions. QE usually leads to a weaker US Dollar.
Quantitative tightening (QT) is the reverse process whereby the Federal Reserve stops buying bonds from financial institutions and does not reinvest the principal from the bonds it holds maturing in new purchases. It is usually positive for the US Dollar.
Sikat na Artikulo
1IMF says the biggest risk is prolonged conflict2British Pound sticks to gains vs USD as BoE Pill's dovish tone cap upside ahead of UK data3Silver Price Forecast: XAG/USD rebounds to near $56.00 as oil prices, US Dollar decline4US preparing using ‘mother of all bombs’ against Iran5India Gold price today: Gold rises, according to FXStreet data6Zcash Price Forecast: ZEC declines as US inflation surprise offsets fresh ETF inflows7BoE’s Pill says should not give impression that hike now would be the start of a series of increases8New Zealand Dollar jumps to two-week top vs weak USD as RBNZ's Conway hints rate hikes9Ripple and Stellar outlook: XRP and XLM extend losses as US inflation data weighs in
LIVE QUOTES


LAHAT TUNGKOL SA FOREX
Magsimula!
Mag-sign up at ma-access ang Global Markets sa loob ng 3 minuto

Makipag-ugnayan sa Amin












Ang impormasyong ibinigay sa website na ito ay pangkalahatang impormasyon lamang at hindi bumubuo ng personal na payong pinansyal. Bago kumilos batay sa anumang impormasyon sa website na ito, dapat mong isaalang-alang ang pagiging angkop ng impormasyon kaugnay ng iyong mga layunin, kalagayang pinansyal, at mga pangangailangan. Ang pag-iinvest sa CFDs at FX Margin Contracts ay may kaakibat na malalaking panganib at hindi angkop para sa lahat ng mamumuhunan. Maaari kang mawalan ng higit pa sa iyong paunang deposito. Wala kang pagmamay-ari o anumang interes sa pinagbabatayang asset. Inirerekomenda namin na humingi ka ng independiyenteng payo at tiyaking lubos mong nauunawaan ang mga panganib na kasangkot bago makipagkalakalan. Mahalaga na basahin at isaalang-alang mo ang dokumento ng pagsisiwalat bago ka kumuha ng anumang produktong nakalista sa website. Ang impormasyon at mga patalastas na inaalok sa website na ito ay hindi nilalayong gamitin ng sinumang tao sa alinmang bansa o hurisdiksyon kung saan ang ganitong paggamit ay labag sa mga lokal na batas at regulasyon. Ang mga Produkto at Serbisyong inaalok sa website na ito ay hindi nilalayong para sa mga residente ng United States, Malaysia, at Thailand.
Ang TMGM ay awtorisado at pinangangasiwaan sa iba't ibang hurisdiksyon.
Ang Trademax Australia Limited, na nag-trading bilang TMGM, ay pinangangasiwaan ng Australian Securities and Investments Commission (ASIC), AFSL no. 436416 at matatagpuan sa Level 28, One International Tower, 100 Barangaroo Avenue, 2000 Sydney, NSW Australia.
Email: [email protected]
Ang Trademax Global Limited, na nag-trading bilang TMGM, ay awtorisado at pinangangasiwaan ng Vanuatu Financial Services Commission (VFSC), registration number 40356 at nakarehistro sa 1276, Kumul Highway, Port Vila, Vanuatu, Republic of Vanuatu.
Email: [email protected]
Ang Trademax Global Markets (SE) Limited, na kilala bilang TMGM, ay awtorisado at nire-regulahan ng Financial Services Authority (FSA) ng Seychelles, na may lisensya bilang SD224. Ang kumpanya ay nakarehistro sa Office Blg. 13, Providence Estate ABIS Centre, Mahe, Seychelles.
Email: [email protected]
Ang Trademax Global Markets (International) Pty Ltd, na nag-trading bilang TMGM, ay awtorisado at pinangangasiwaan ng Financial Services Commission, Mauritius (FSC) na may license no. GB22201012, at nakarehistro sa 33, Edith Cavell Street C/o IQ EQ Fund Services (Mauritius) Ltd Port Louis, 11324 Mauritius.
Email: [email protected]
Copyright © TMGM. Lahat ng karapatan ay nakalaan