

Trading
Erkunden Sie eine breite Palette von Märkten mit wettbewerbsfähigen Preisen, tiefer Liquidität und fortschrittlichen Trading-Tools.
Mehr erfahren 
Plattform
Handeln Sie nahtlos mit TMGMs leistungsstarker Plattform, die für Geschwindigkeit, Präzision und ein überlegenes Trading-Erlebnis entwickelt wurde.
Mehr erfahren Trading-Plattform
Akademie
Lernen Sie die Grundlagen des Tradings mit anfängerfreundlichen Ressourcen, einschließlich Leitfäden, Webinaren und Markteinblicken.
Mehr erfahren Nachrichten & Analyse
Erhalten Sie Echtzeit-Markt-Updates und Expertenanalysen, um Trading-Gelegenheiten voraus zu sein
Mehr erfahren Nachrichten & Analyse
Über uns
Erfahren Sie, was TMGM auszeichnet — unsere globale Präsenz, regulatorische Stärke und unser Engagement für Innovation im Trading.
Mehr erfahren Warum TMGM wählen
Bitcoin/Gold Outlook: BTC falls below $84K support as XAU/USD remains under pressure
- Bitcoin declines below $84,000, signaling potential profit-taking and buyer exhaustion.
- Gold’s technical weakness persists as the price slips further below $4,300.
- Fed rate hike bets for October ease but remain elevated, weighing on market sentiment.
Bitcoin (BTC) ticks lower below $84,000 on Friday as prices continue to moderate after early-week gains. The Crypto King briefly traded above $87,000 on Monday before gradually correcting, underpinning possible profit-taking and macroeconomic uncertainty-related turbulence.
Gold (XAU/USD) trades below $4,300, aligning with prevailing bearish momentum signals. Upside potential remains limited by a dense cluster of moving average resistance. If the downtrend persists, the next key support zone lies around $4,200, an area that previously attracted buying interest.

Focus remains on US interest rates
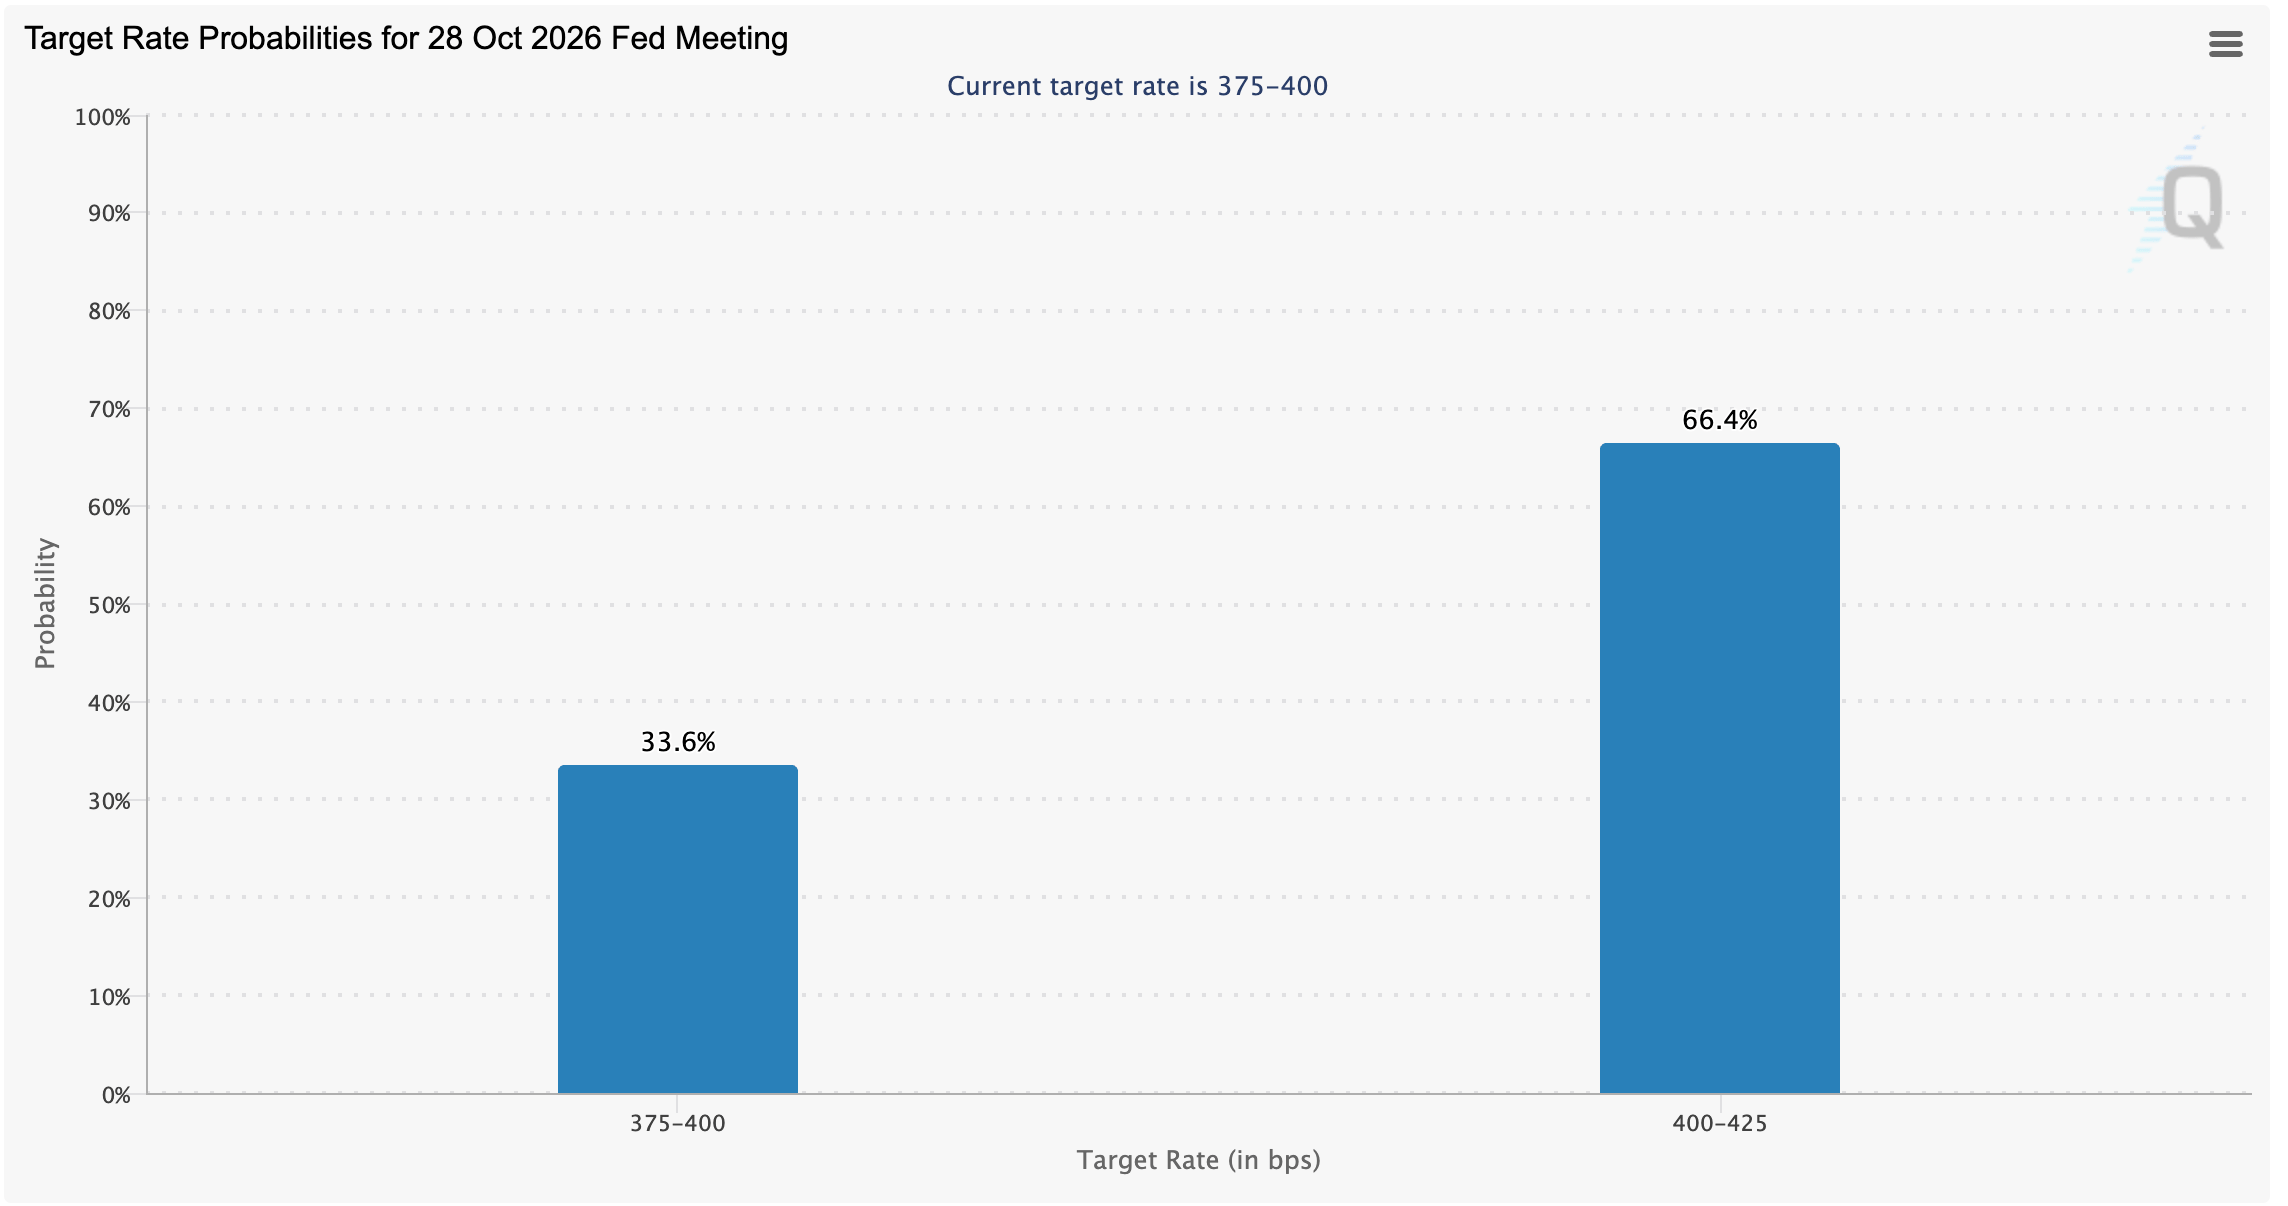
Markets are pricing in a higher probability, approximately 66%, that the United States (US) Federal Reserve (Fed) will log a second consecutive interest rate hike in October to range between 4.00% and 4.25%, according to the CME Group's FedWatch Tool.
Beyond the rate-hike uncertainty, which continues to weigh on market sentiment, focus remains on Treasury yields, which, according to the Crypto Finance team, are pushing into territory not seen in two decades.
“The 10-year climbed above 5.2% for the first time since 2007, while the 30-year reached 5.5%, a level last seen in 2004. The catalyst was not a single event but a combination of stronger-than-expected growth, stubborn inflation pressure and weak demand for government debt,” Crypto Finance said in an emailed daily report.
In addition to the Fed adopting a hawkish monetary stance amid persistent inflation risks within a resilient economy, investors are also watching for changes in Treasury yields. At the same time, Oil and energy are other overarching headwinds amid tensions in the Middle East, especially the Red Sea. Although West Texas Intermediate (WTI) has eased since mid-September, prices remain elevated at $92.00 compared to July’s low of $67.00.
Technical analysis: Bitcoin slides as headwinds intensify
Bitcoin trades at $83,789, slipping beneath the key psychological threshold of $84,000. This pullback comes on the heels of Monday’s surge to a weekly high of $87,378, suggesting a potential shift in short-term market momentum. Despite the correction, BTC broadly upholds a bullish near-term bias as price sits well above the 50-day, 100-day and 200-day Exponential Moving Averages (EMAs).
The short-term EMA near $76,442 and the SuperTrend line around $78,352 trail well below spot, hinting that the recent breakout remains supported despite elevated levels. Meanwhile, momentum stays constructive, with the Relative Strength Index (RSI) at 63, comfortably out of overbought territory. The Moving Average Convergence Divergence (MACD) indicator remains positive, suggesting buyers retain control even as upside momentum moderates.
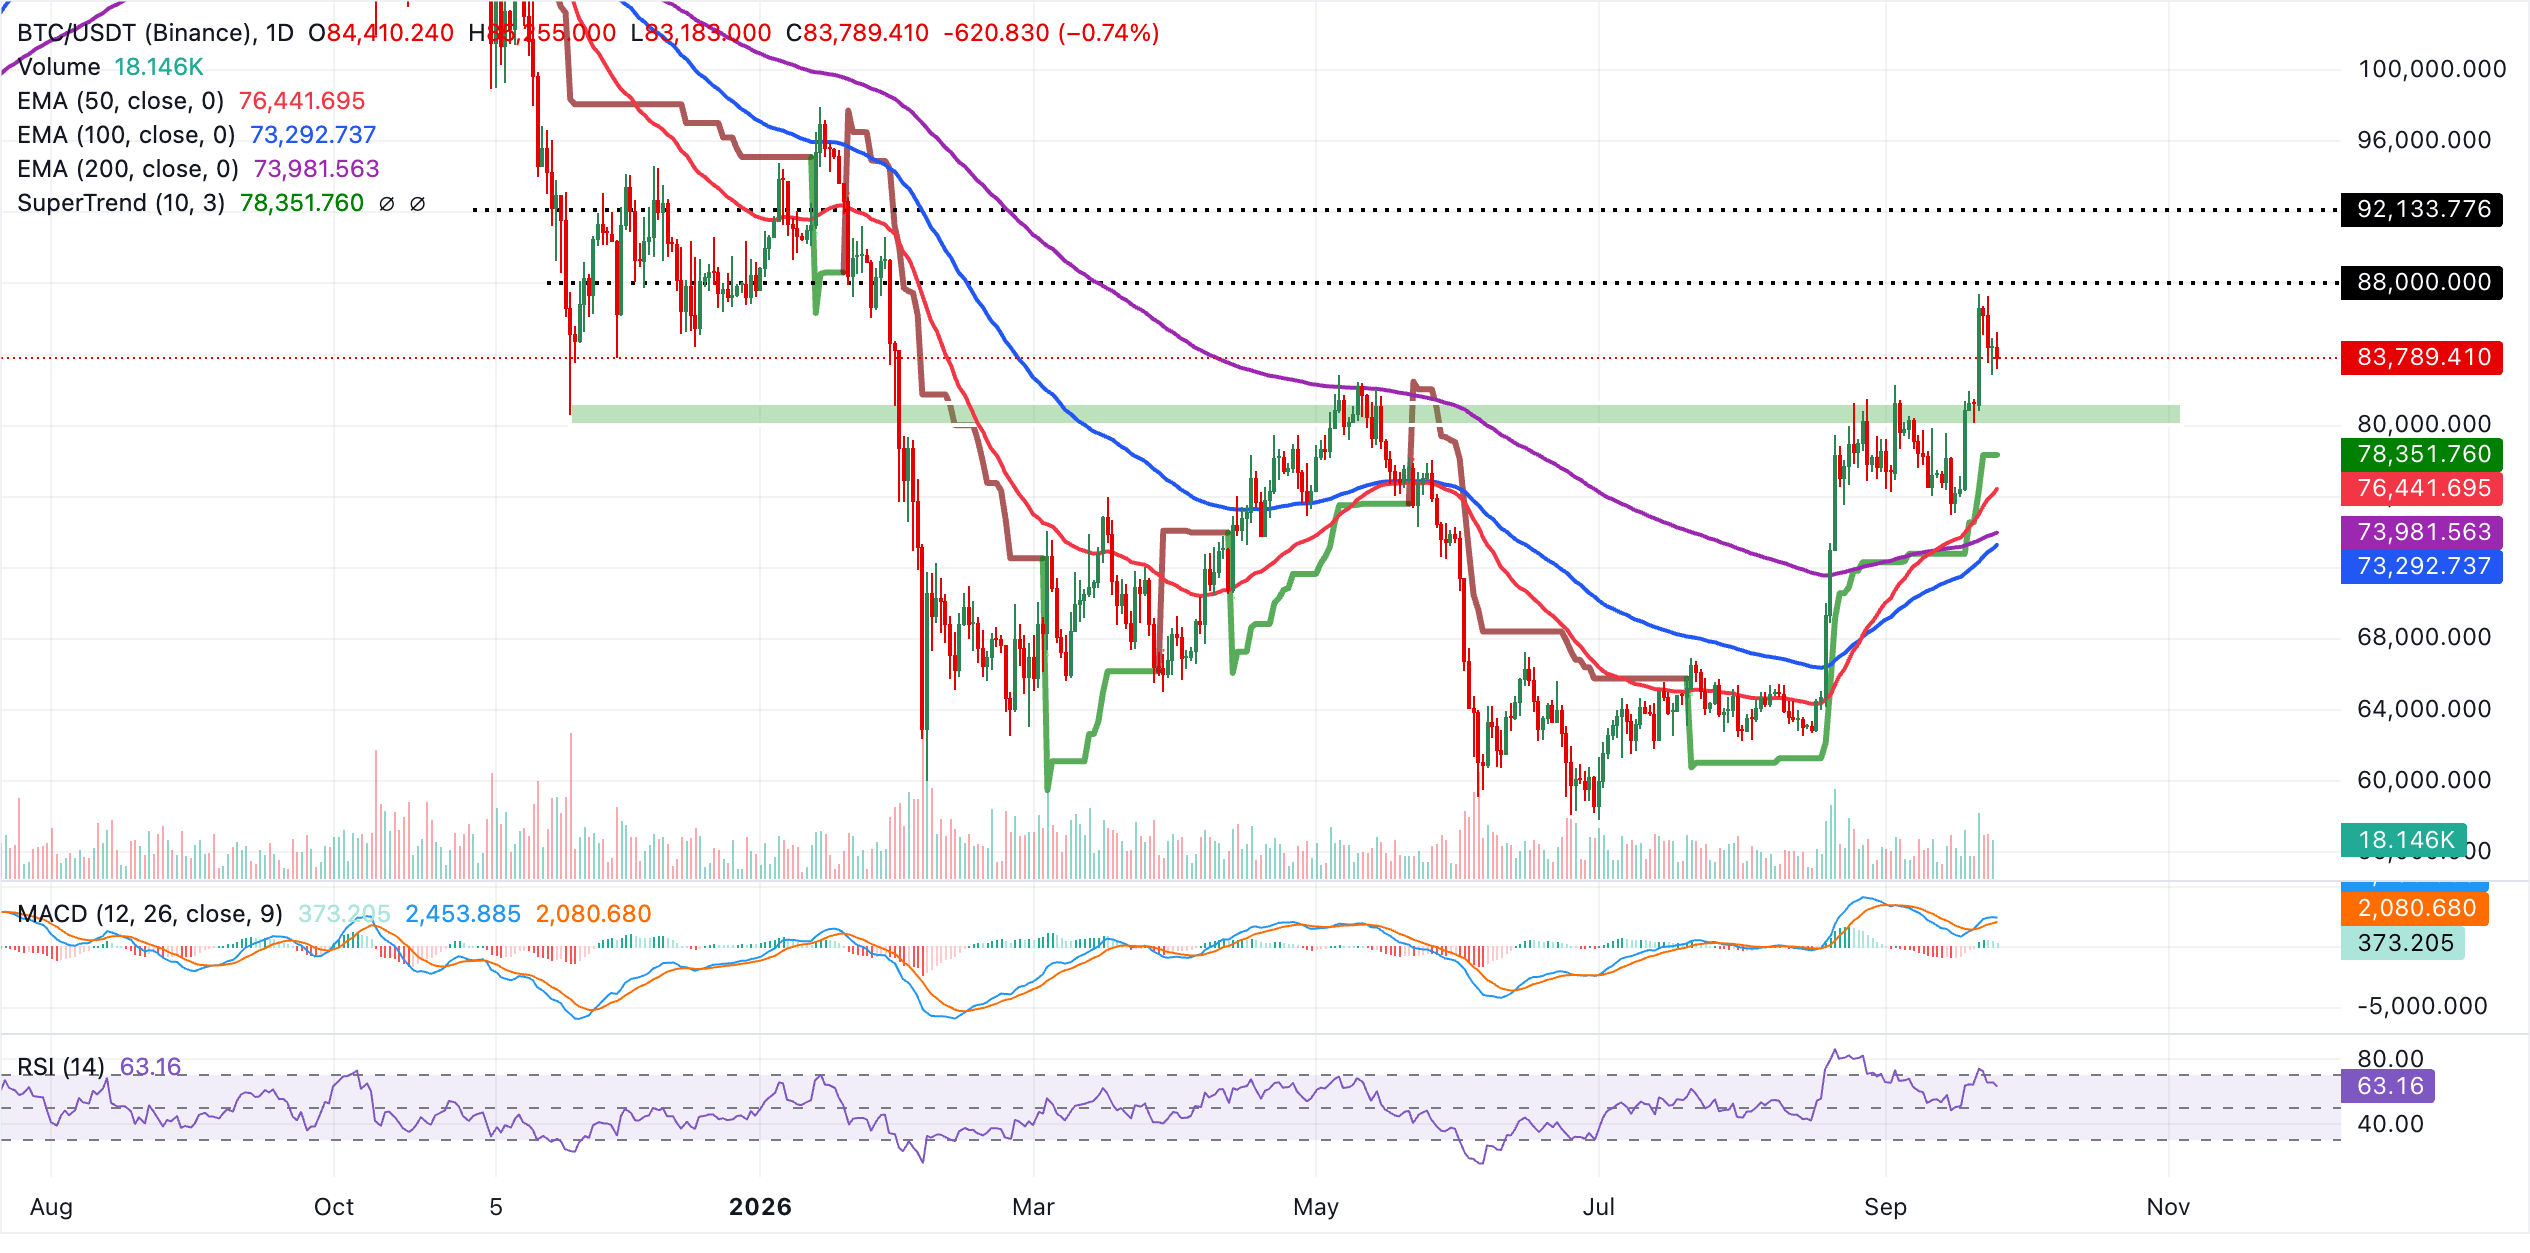
Initial support is seen at the SuperTrend baseline around $78,352, ahead of the 50-day EMA at roughly $76,442, both cushioning any corrective pullback. A deeper slide would bring the 200-day EMA near $73,981 into view, followed by the 100-day EMA around $73,293, where a stronger layer of medium-term demand is likely to emerge and keep the broader bullish structure intact as long as these levels hold.
Gold technical outlook: XAU/USD struggles amid a weakening technical structure
Gold trades at $4,265, retaining a bearish near-term bias as spot holds beneath a dense cap of moving averages and trend resistance. Price remains below the 50-day, 100-day and 200-day EMAs clustered between roughly $4,320 and $4,360, suggesting that recent rebounds are still occurring within a broader corrective phase.
The SuperTrend indicator remains above price at $4,551, reinforcing the idea that upside is constrained. Momentum has softened, with the RSI drifting into the low-40s and the MACD below zero with a negative histogram, hinting at persistent selling pressure rather than an imminent bullish reversal.
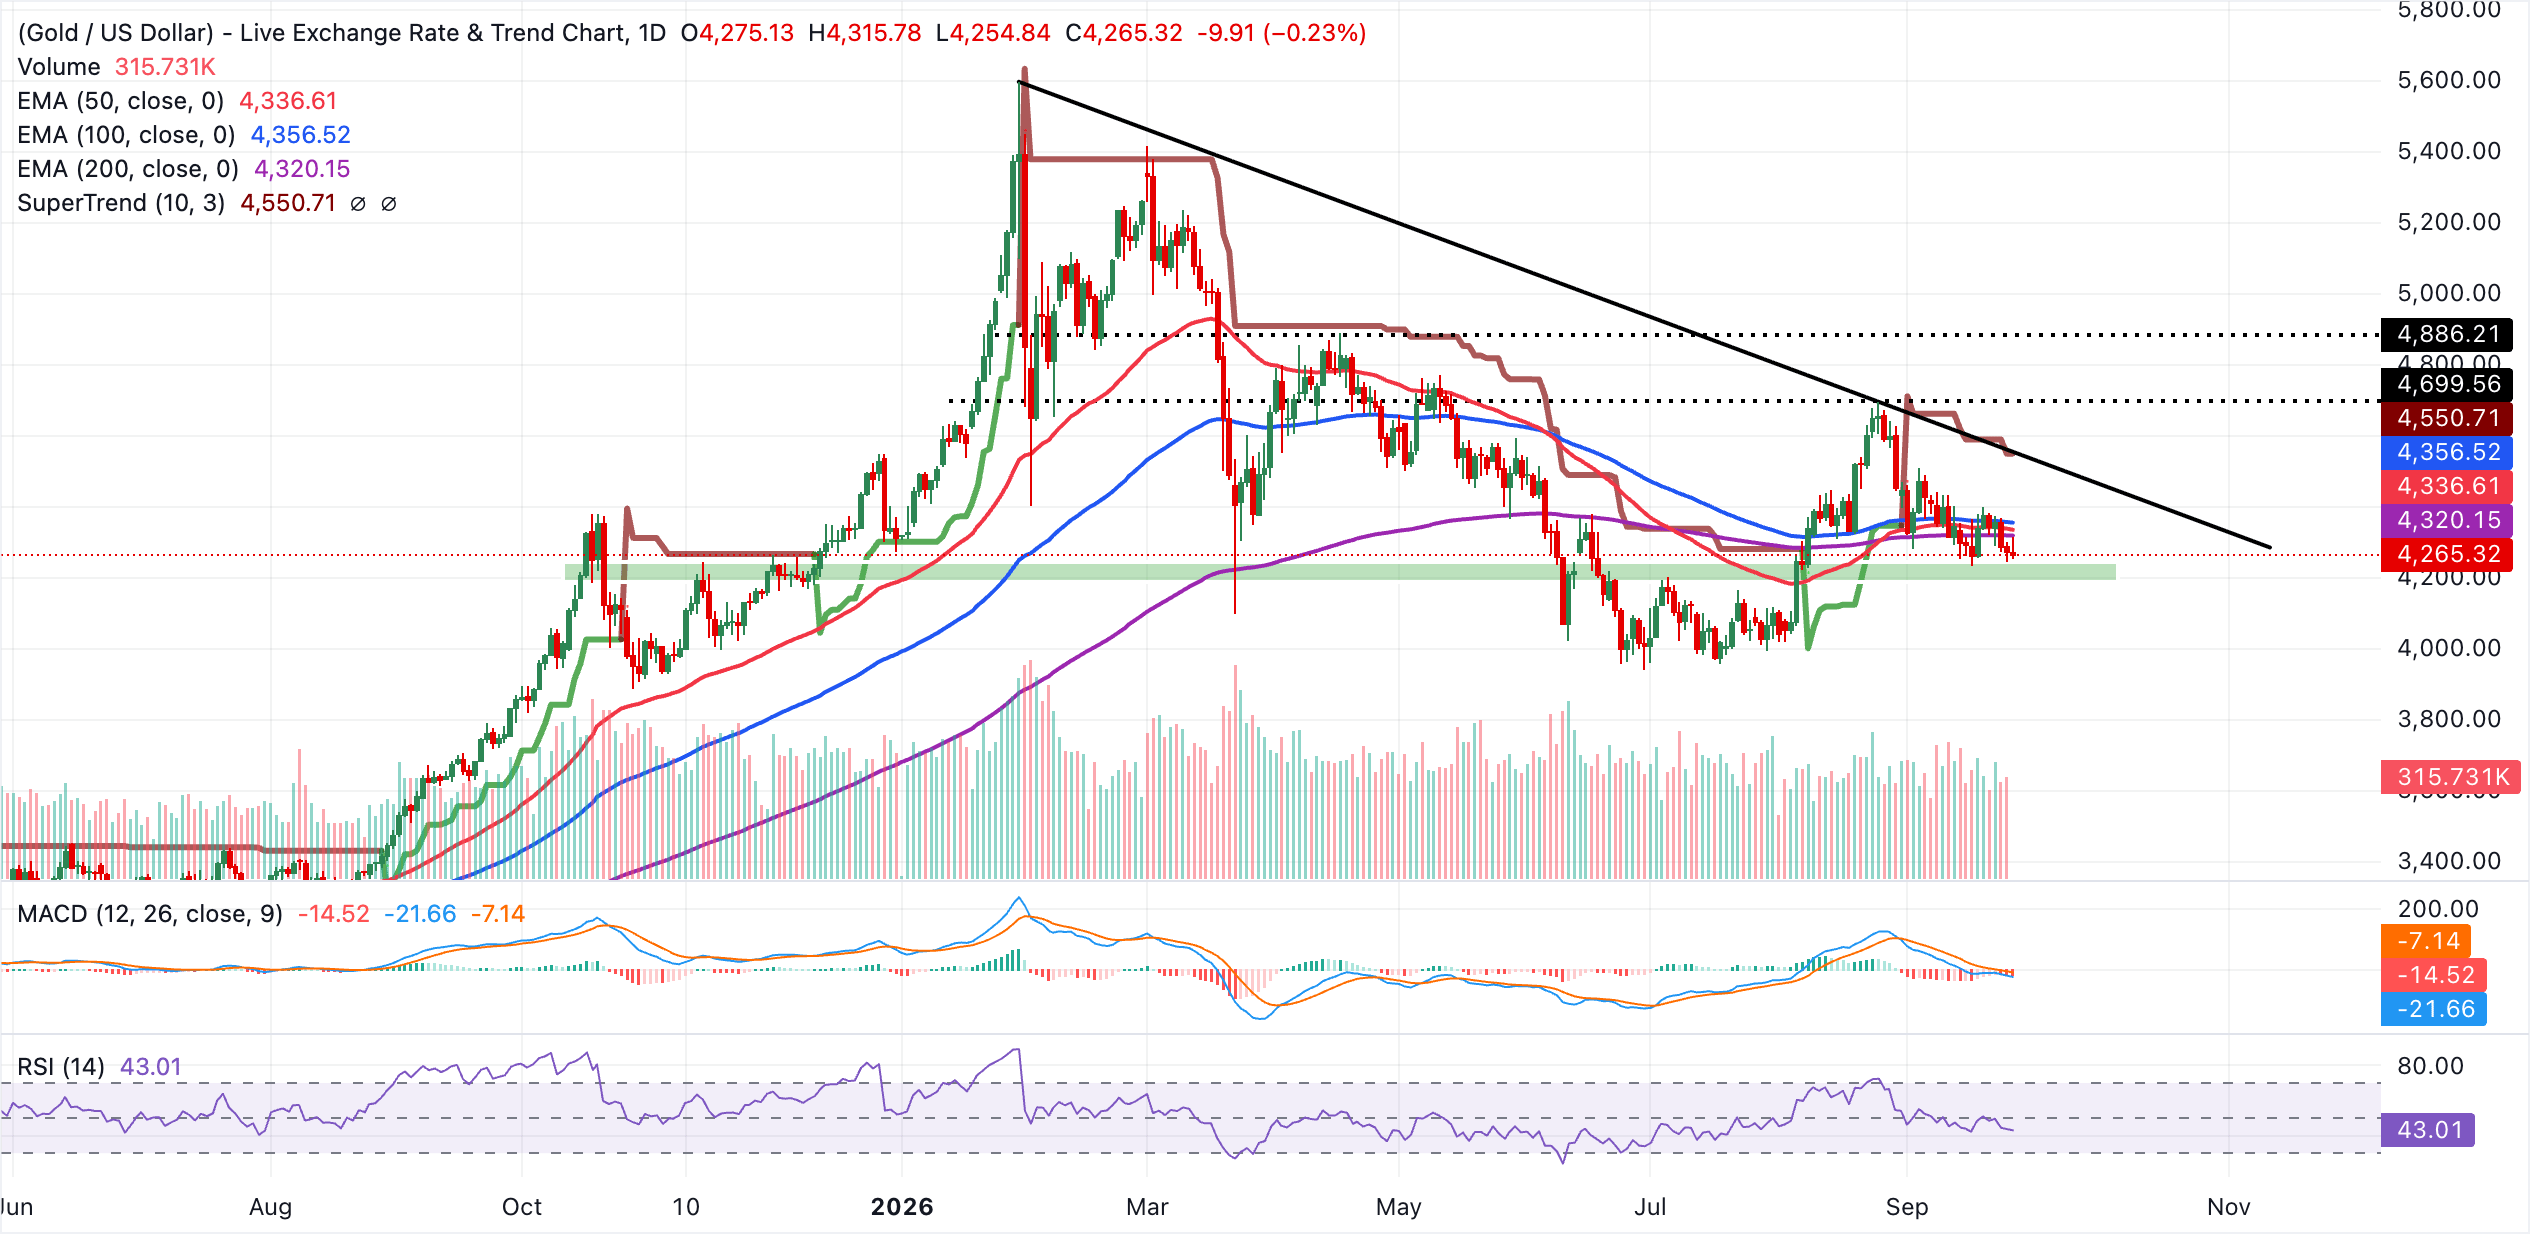
Initial resistance lies at the 200-day EMA near $4,320, followed by the 50-day EMA at $4,337 and the 100-day EMA at $4,357, forming a critical supply band that bulls would need to reclaim to neutralize the current bearish tone.
Above that zone, the downward trendline’s break level around $4,488 comes ahead of the SuperTrend barrier at $4,551, which marks a more decisive threshold for a sustained recovery. With no nearby structural supports on the daily chart, any fresh downside extension would likely be driven by momentum rather than clear chart floors, keeping gold vulnerable while it trades under these layered resistance levels.
(The technical analysis of this story was written with the help of an AI tool. Know more.)
Bitcoin, altcoins, stablecoins FAQs
Bitcoin is the largest cryptocurrency by market capitalization, a virtual currency designed to serve as money. This form of payment cannot be controlled by any one person, group, or entity, which eliminates the need for third-party participation during financial transactions.
Altcoins are any cryptocurrency apart from Bitcoin, but some also regard Ethereum as a non-altcoin because it is from these two cryptocurrencies that forking happens. If this is true, then Litecoin is the first altcoin, forked from the Bitcoin protocol and, therefore, an “improved” version of it.
Stablecoins are cryptocurrencies designed to have a stable price, with their value backed by a reserve of the asset it represents. To achieve this, the value of any one stablecoin is pegged to a commodity or financial instrument, such as the US Dollar (USD), with its supply regulated by an algorithm or demand. The main goal of stablecoins is to provide an on/off-ramp for investors willing to trade and invest in cryptocurrencies. Stablecoins also allow investors to store value since cryptocurrencies, in general, are subject to volatility.
Bitcoin dominance is the ratio of Bitcoin's market capitalization to the total market capitalization of all cryptocurrencies combined. It provides a clear picture of Bitcoin’s interest among investors. A high BTC dominance typically happens before and during a bull run, in which investors resort to investing in relatively stable and high market capitalization cryptocurrency like Bitcoin. A drop in BTC dominance usually means that investors are moving their capital and/or profits to altcoins in a quest for higher returns, which usually triggers an explosion of altcoin rallies.
BELIEBTE ARTIKEL
1Dow Jones Industrial Average bounces on Iran's latest Hormuz offer2Bitcoin/Gold Outlook: BTC falls below $84K support as XAU/USD remains under pressure3British Pound finds relief as USD pauses, but inflation risks linger4Canadian Dollar: Undervalued near 1.41 against US Dollar – Scotiabank5Euro: Correction seen near key averages against US Dollar – Societe Generale6Euro set for third weekly decline as hawkish Federal Reserve outlook weighs7Australian Dollar: RBA hike expectations shape outlook – ING8US Dollar: Yields support Greenback strength – OCBC9Australian Dollar rebounds from 0.7000 as US Dollar eases after strong week
LIVE-KURSE


ALLES ÜBER GOLD & PRECIOUS METALS
Wie man Gold (XAUUSD) im Forex-Handel tradet
Handelszeiten für Gold (XAUUSD): Die beste Zeit, Gold zu handeln
Wie man Gold handelt
Warum in Gold-CFDs investieren? Ein Leitfaden für Einsteiger zum intelligenten Investieren
7 Möglichkeiten, in Gold zu investieren
Leitfaden zur Zählung von Gold-Pips in einem dynamischen Markt
Gold-Handelstechniken, die Sie 2025 nutzen können
Was ist Goldhandel: Wie er funktioniert & wie man damit handelt
Jetzt loslegen!
Registrieren Sie sich und erhalten Sie in weniger als 3 Minuten Zugang zu den globalen Märkten

Verbinden Sie sich mit uns












Die auf dieser Website bereitgestellten Informationen sind ausschließlich allgemeiner Natur und stellen keine persönliche Finanzberatung dar. Bevor Sie auf Grundlage von Informationen auf dieser Website handeln, sollten Sie die Eignung dieser Informationen im Hinblick auf Ihre Ziele, Ihre finanzielle Situation und Ihre Bedürfnisse prüfen. Investitionen in CFDs und FX-Margin-Kontrakte sind mit erheblichen Risiken verbunden und nicht für alle Anleger geeignet. Sie können mehr als Ihre ursprüngliche Einzahlung verlieren. Sie besitzen weder das zugrunde liegende Vermögenswert noch haben Sie ein Interesse daran. Wir empfehlen Ihnen, unabhängigen Rat einzuholen und sicherzustellen, dass Sie die damit verbundenen Risiken vor dem Handel vollständig verstehen. Es ist wichtig, dass Sie das Offenlegungsdokument lesen und berücksichtigen, bevor Sie ein auf der Website aufgeführtes Produkt erwerben. Die auf dieser Website angebotenen Informationen und Werbeanzeigen sind nicht für die Nutzung durch Personen in Ländern oder Rechtsordnungen bestimmt, in denen eine solche Nutzung gegen lokale Gesetze und Vorschriften verstoßen würde. Die auf dieser Website angebotenen Produkte und Dienstleistungen sind nicht für Einwohner der Vereinigten Staaten, Malaysias und Thailands bestimmt.
TMGM ist in verschiedenen Gerichtsbarkeiten autorisiert und reguliert.
Trademax Australia Limited, handelnd als TMGM, wird von der Australian Securities and Investments Commission (ASIC) reguliert, AFSL Nr. 436416 und befindet sich in Level 28, One International Tower, 100 Barangaroo Avenue, 2000 Sydney, NSW Australien.
E-Mail: [email protected]
Trademax Global Limited, handelnd als TMGM, ist von der Vanuatu Financial Services Commission (VFSC) autorisiert und reguliert, Registrierungsnummer 40356 und registriert unter 1276, Kumul Highway, Port Vila, Vanuatu, Republik Vanuatu.
E-Mail: [email protected]
Die Trademax Global Markets (SE) Limited, tätig unter dem Namen TMGM, ist durch die Financial Services Authority (FSA) der Seychellen autorisiert und reguliert, Lizenznummer SD224. Das Unternehmen ist registriert im Büro Nr. 13, Providence Estate ABIS Centre, Mahé, Seychellen.
E-Mail: [email protected]
Trademax Global Markets (International) Pty Ltd, handelnd als TMGM, ist von der Financial Services Commission, Mauritius (FSC) autorisiert und reguliert mit der Lizenznummer GB22201012 und registriert unter 33, Edith Cavell Street C/o IQ EQ Fund Services (Mauritius) Ltd Port Louis, 11324 Mauritius.
E-Mail: [email protected]
Copyright © TMGM. Alle Rechte vorbehalten