

Bitcoin and Gold Outlook: BTC pulls back as valuation ceilings hold while XAU weakness persists
- Bitcoin largely trades in bearish hands, aiming for $76,000 support after facing rejection at key technical and on-chain levels.
- Bitcoin’s nearest and heaviest supply range falls between $77,000 and $80,000, where long-term holders are likely to continue selling.
- Gold holds below key moving averages, weighed down by deteriorating momentum indicators.
Bitcoin (BTC) corrects alongside the broader cryptocurrency market on Tuesday as selling persists ahead of the United States (US) Federal Reserve (Fed) monetary policy decision. Market participants expect the central bank to raise interest rates to 3.75%-4.00% on Wednesday, potentially weighing on risk assets.

Meanwhile, Gold (XAU/USD) trades lethargically below $4,300 while holding above a short-term $4,250 support. The metal has declined for the second consecutive day, as focus remains on the Federal Open Market Committee (FOMC) meeting.
The Crypto Finance team stated in a Tuesday market report that “we expect the FOMC announcement and subsequent press conference to be a major volatility catalyst, with the potential for sharp and erratic moves across asset classes.”
Bitcoin cools on encountering key valuation hurdles
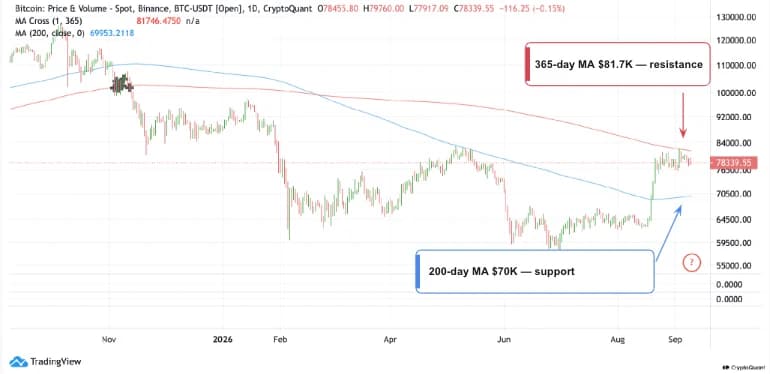
Bitcoin remains relatively resilient, holding around $76,000 despite the recent rejection from September highs above $82,000. A weekly crypto report by CryptoQuant highlights several key valuation ceilings that may continue to hinder a significant breakout in Bitcoin price, including the 365-day Moving Average (MA) at $81,700. Bitcoin bull markets have historically kicked off when the price closes above this moving average, while closing below it has often marked the start of bear markets, the report says.
“A decisive break above it would confirm the new bull market and open room for a new leg up; a rejection keeps Bitcoin range-bound,” CryptoQuant analysts added.
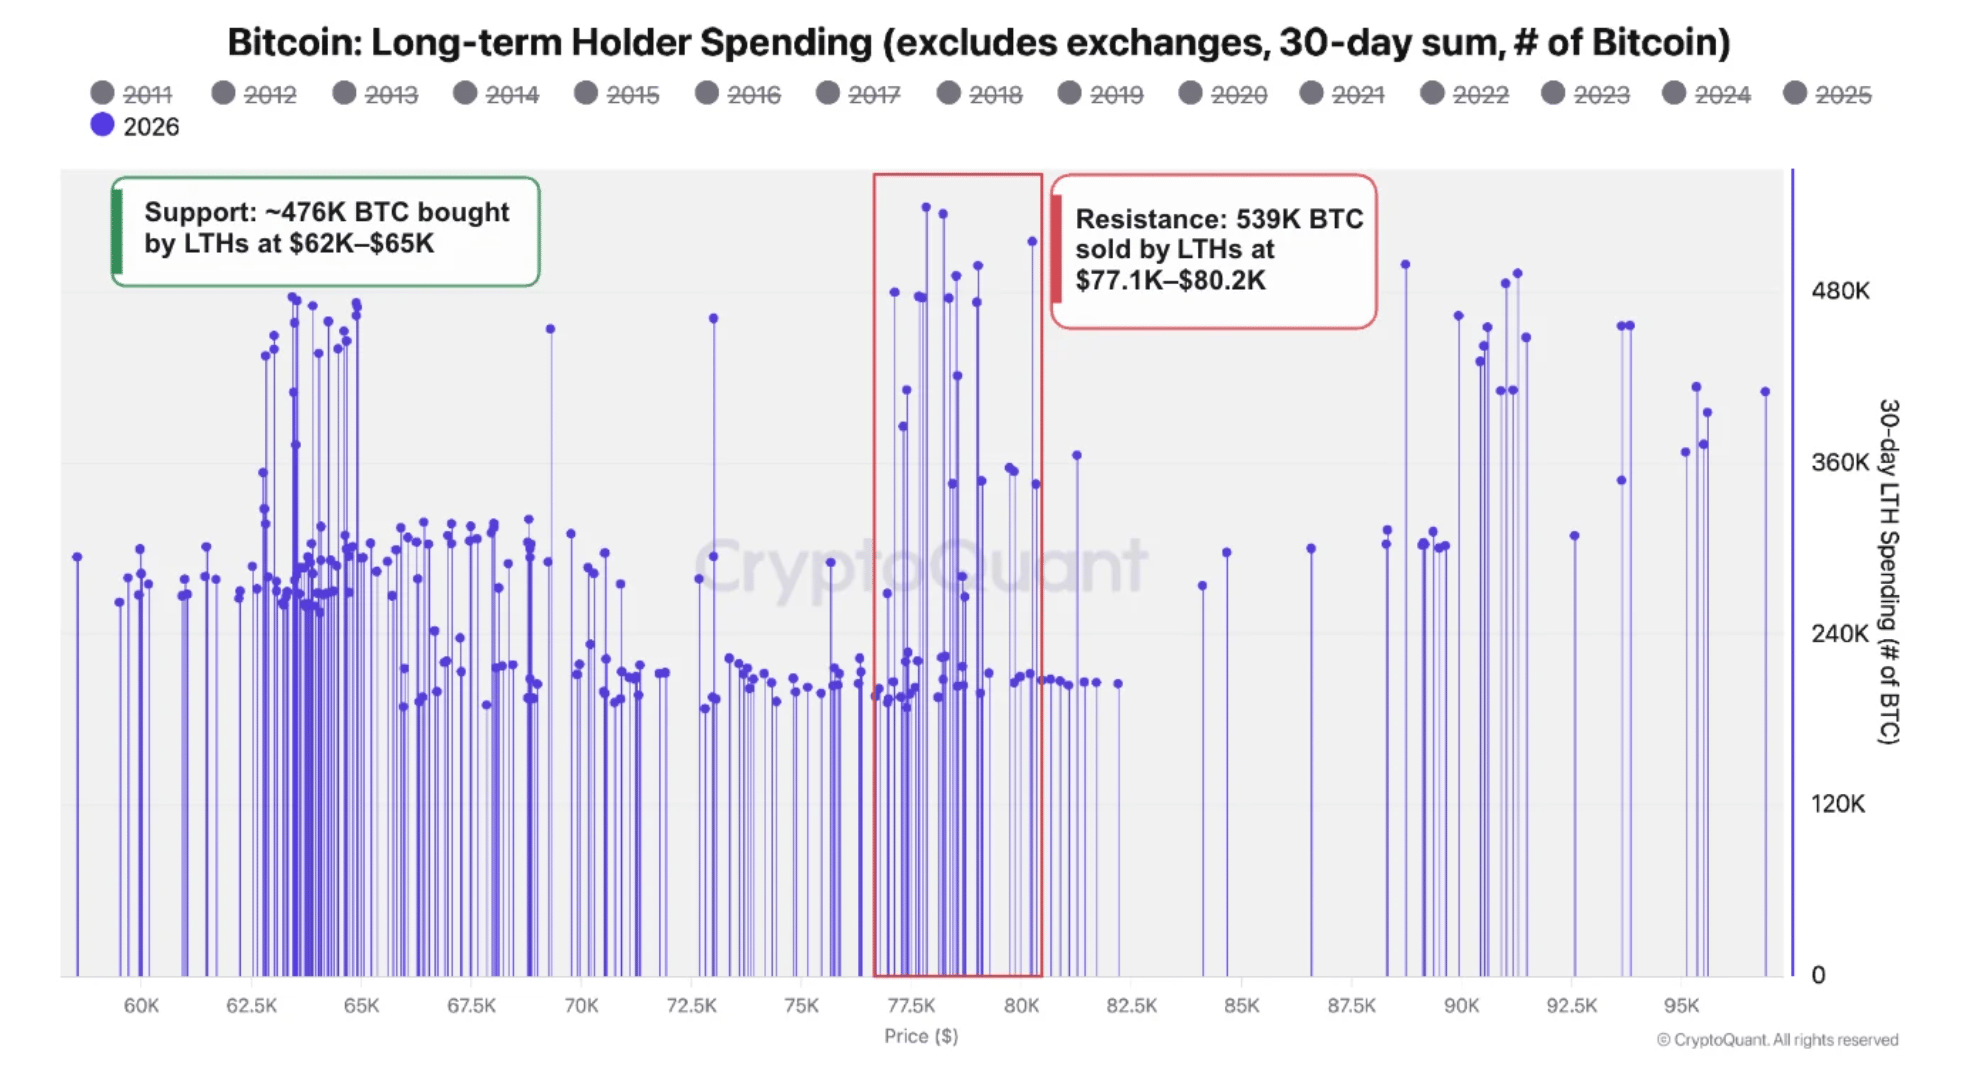
On-chain valuations show the nearest and heaviest resistance band, where supply tends to concentrate, falls between $77,000 and $80,000. Bitcoin Long-term Holder Spending, excluding exchanges, tracked across 30 days shows that roughly 526,000 BTC were sold in that range, which sits directly above the prevailing market level.
Meanwhile, support is concentrated in a lower range between $62,000 and $65,000. Approximately 476,000 BTC were accumulated in the range this year, highlighting a strong demand area. A decisive break above the resistance band is required to mark the next recovery attempt toward the upper valuation ceiling around $88,700.
Technical analysis: Bitcoin retests key support
Bitcoin retains a neutral but firm bias, trading near the short-term $76,000 support. Despite a persistent correction from early September highs, the largest crypto by market capitalization holds above the 50-day, 100-day and 200-day Exponential Moving Averages (EMAs) clustered between roughly $71,300 and $73,500. This setup suggests the broader trend remains constructive despite the latest pullback from recent highs.
However, the Moving Average Convergence Divergence (MACD) is in negative territory on the daily chart with its latest reading deep below zero, hinting that downside momentum still weighs on the pair even as the Money Flow Index (MFI) sits in a mid-range zone near 41, indicating neither extreme stress nor strong inflows.
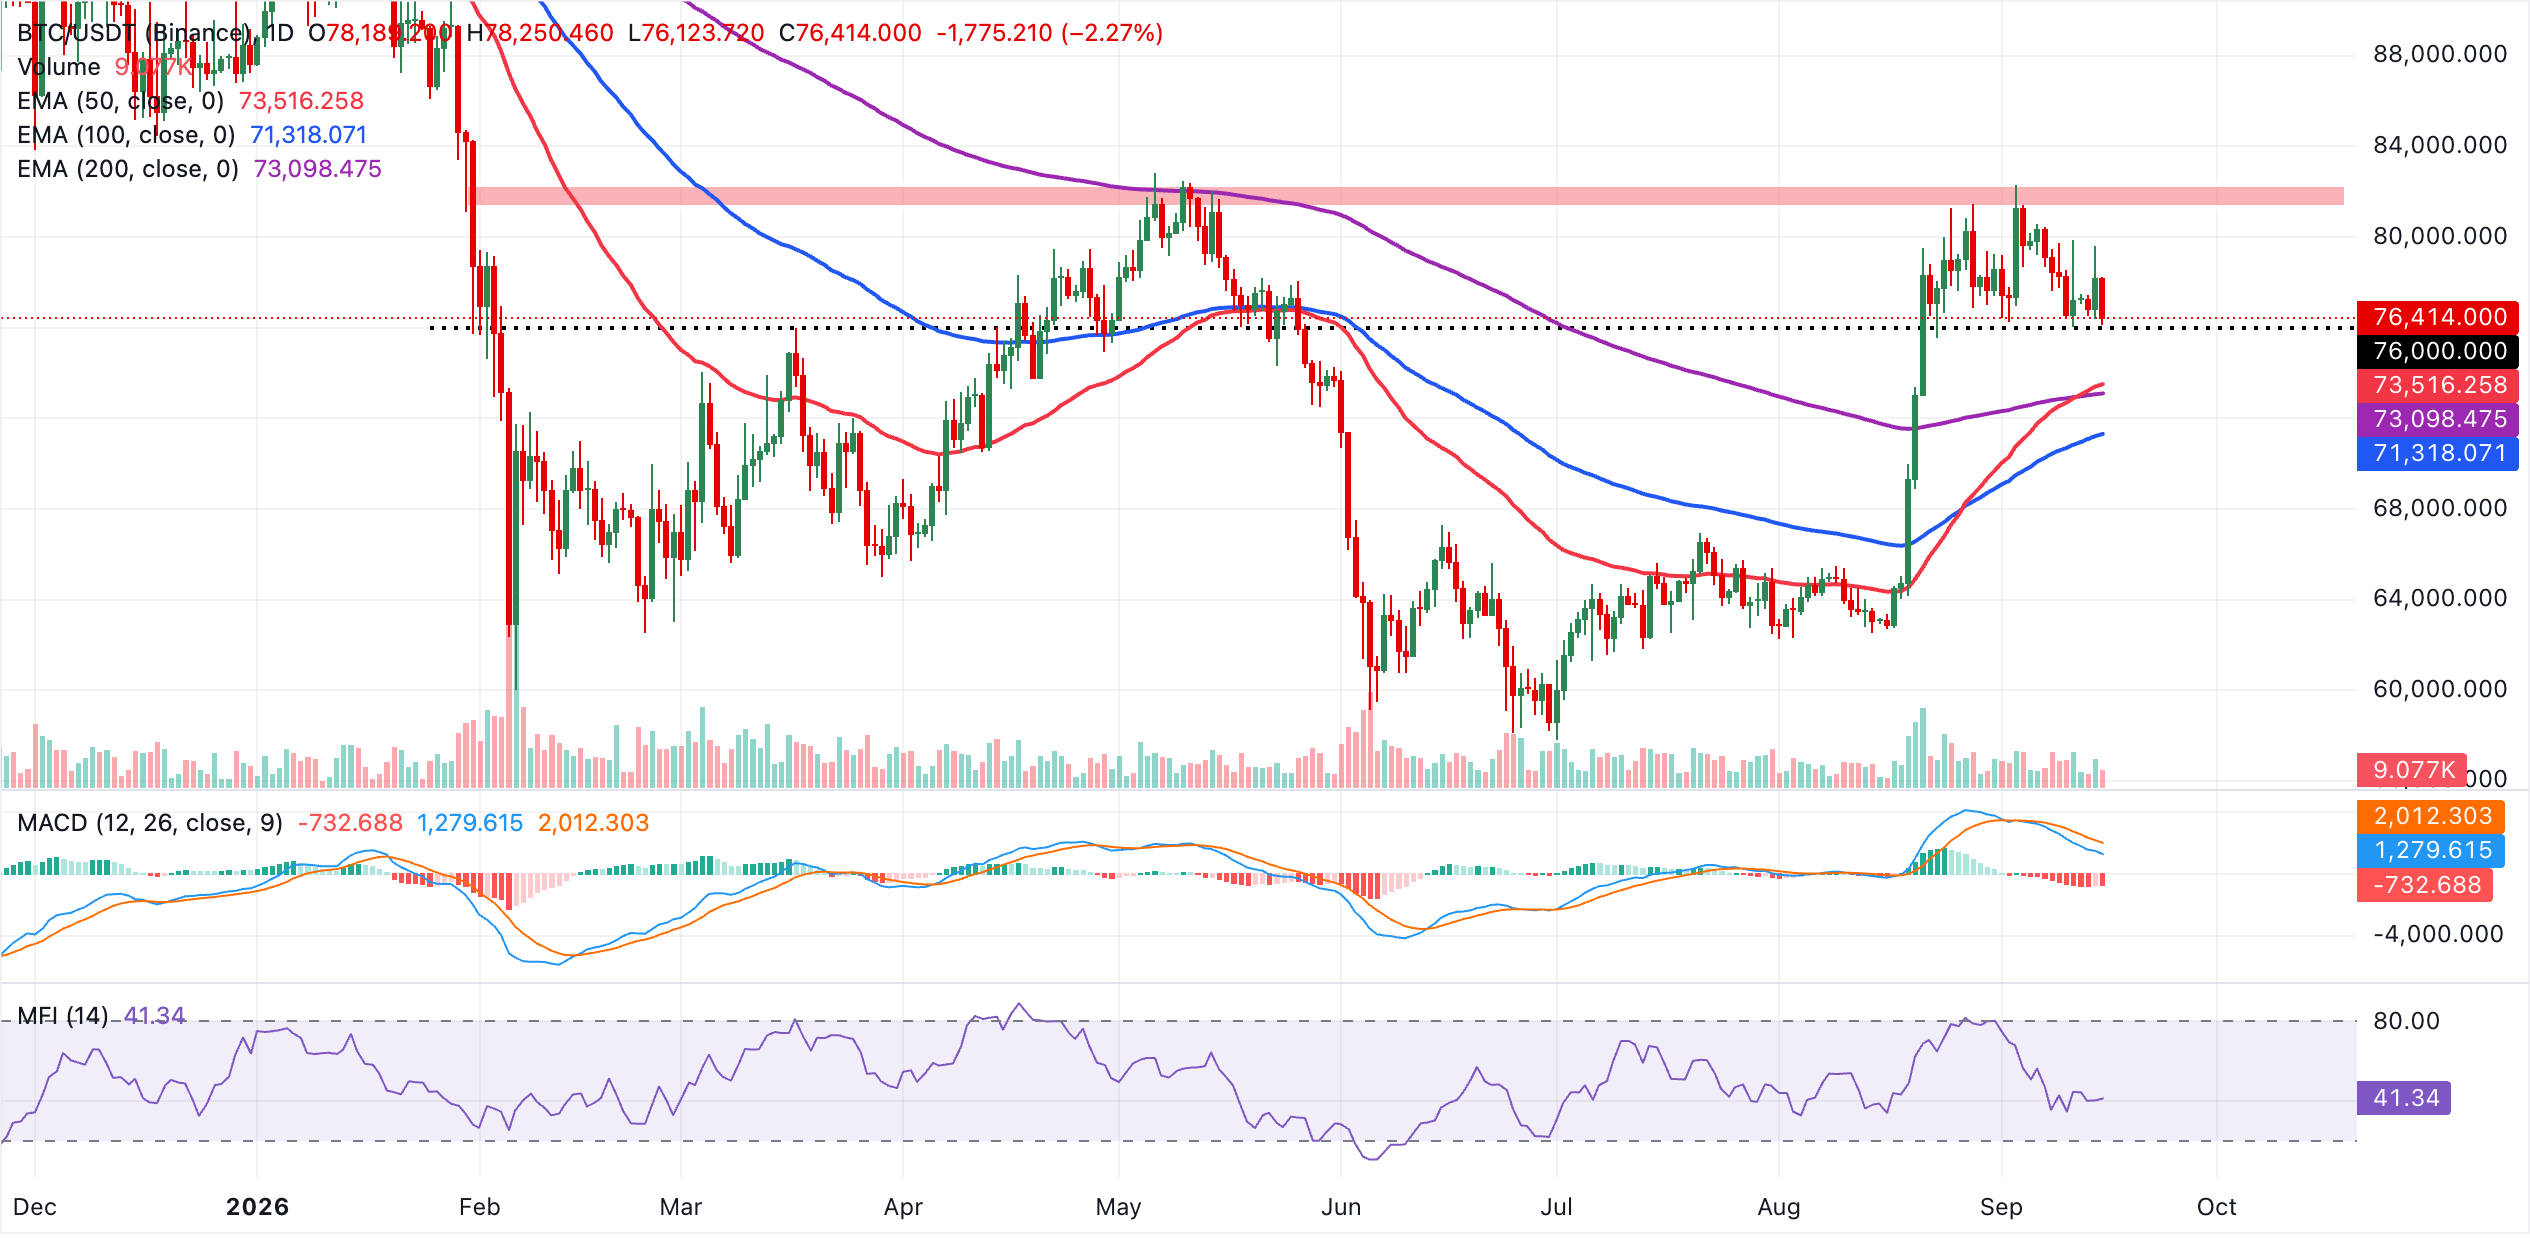
On the downside, the first area to watch is the current-day pivot near $76,000, with the 50-day EMA at $73,516 reinforcing subsequent support, closely followed by the 200-day EMA at $73,098. A deeper setback would expose the 100-day EMA near $71,318 as a more strategic support region. With price holding above this moving-average cluster, the near-term bias stays mildly bullish, but the negative MACD warns that a failure to defend these underlying levels could quickly shift the tone back toward a more pronounced corrective phase.
Gold technical analysis: XAU falters as bears tighten grip
Gold trades at $4,293, maintaining a bearish near-term bias as spot holds below the 50-day, 100-day and 200-day EMAs, clustered between roughly $4,320 and $4,365. The loss of these medium and long-term averages suggests rallies are being capped, while the RSI at 44 leans slightly negative. Moreover, the MACD remains negative, suggesting downside momentum persists despite the latest bounce.
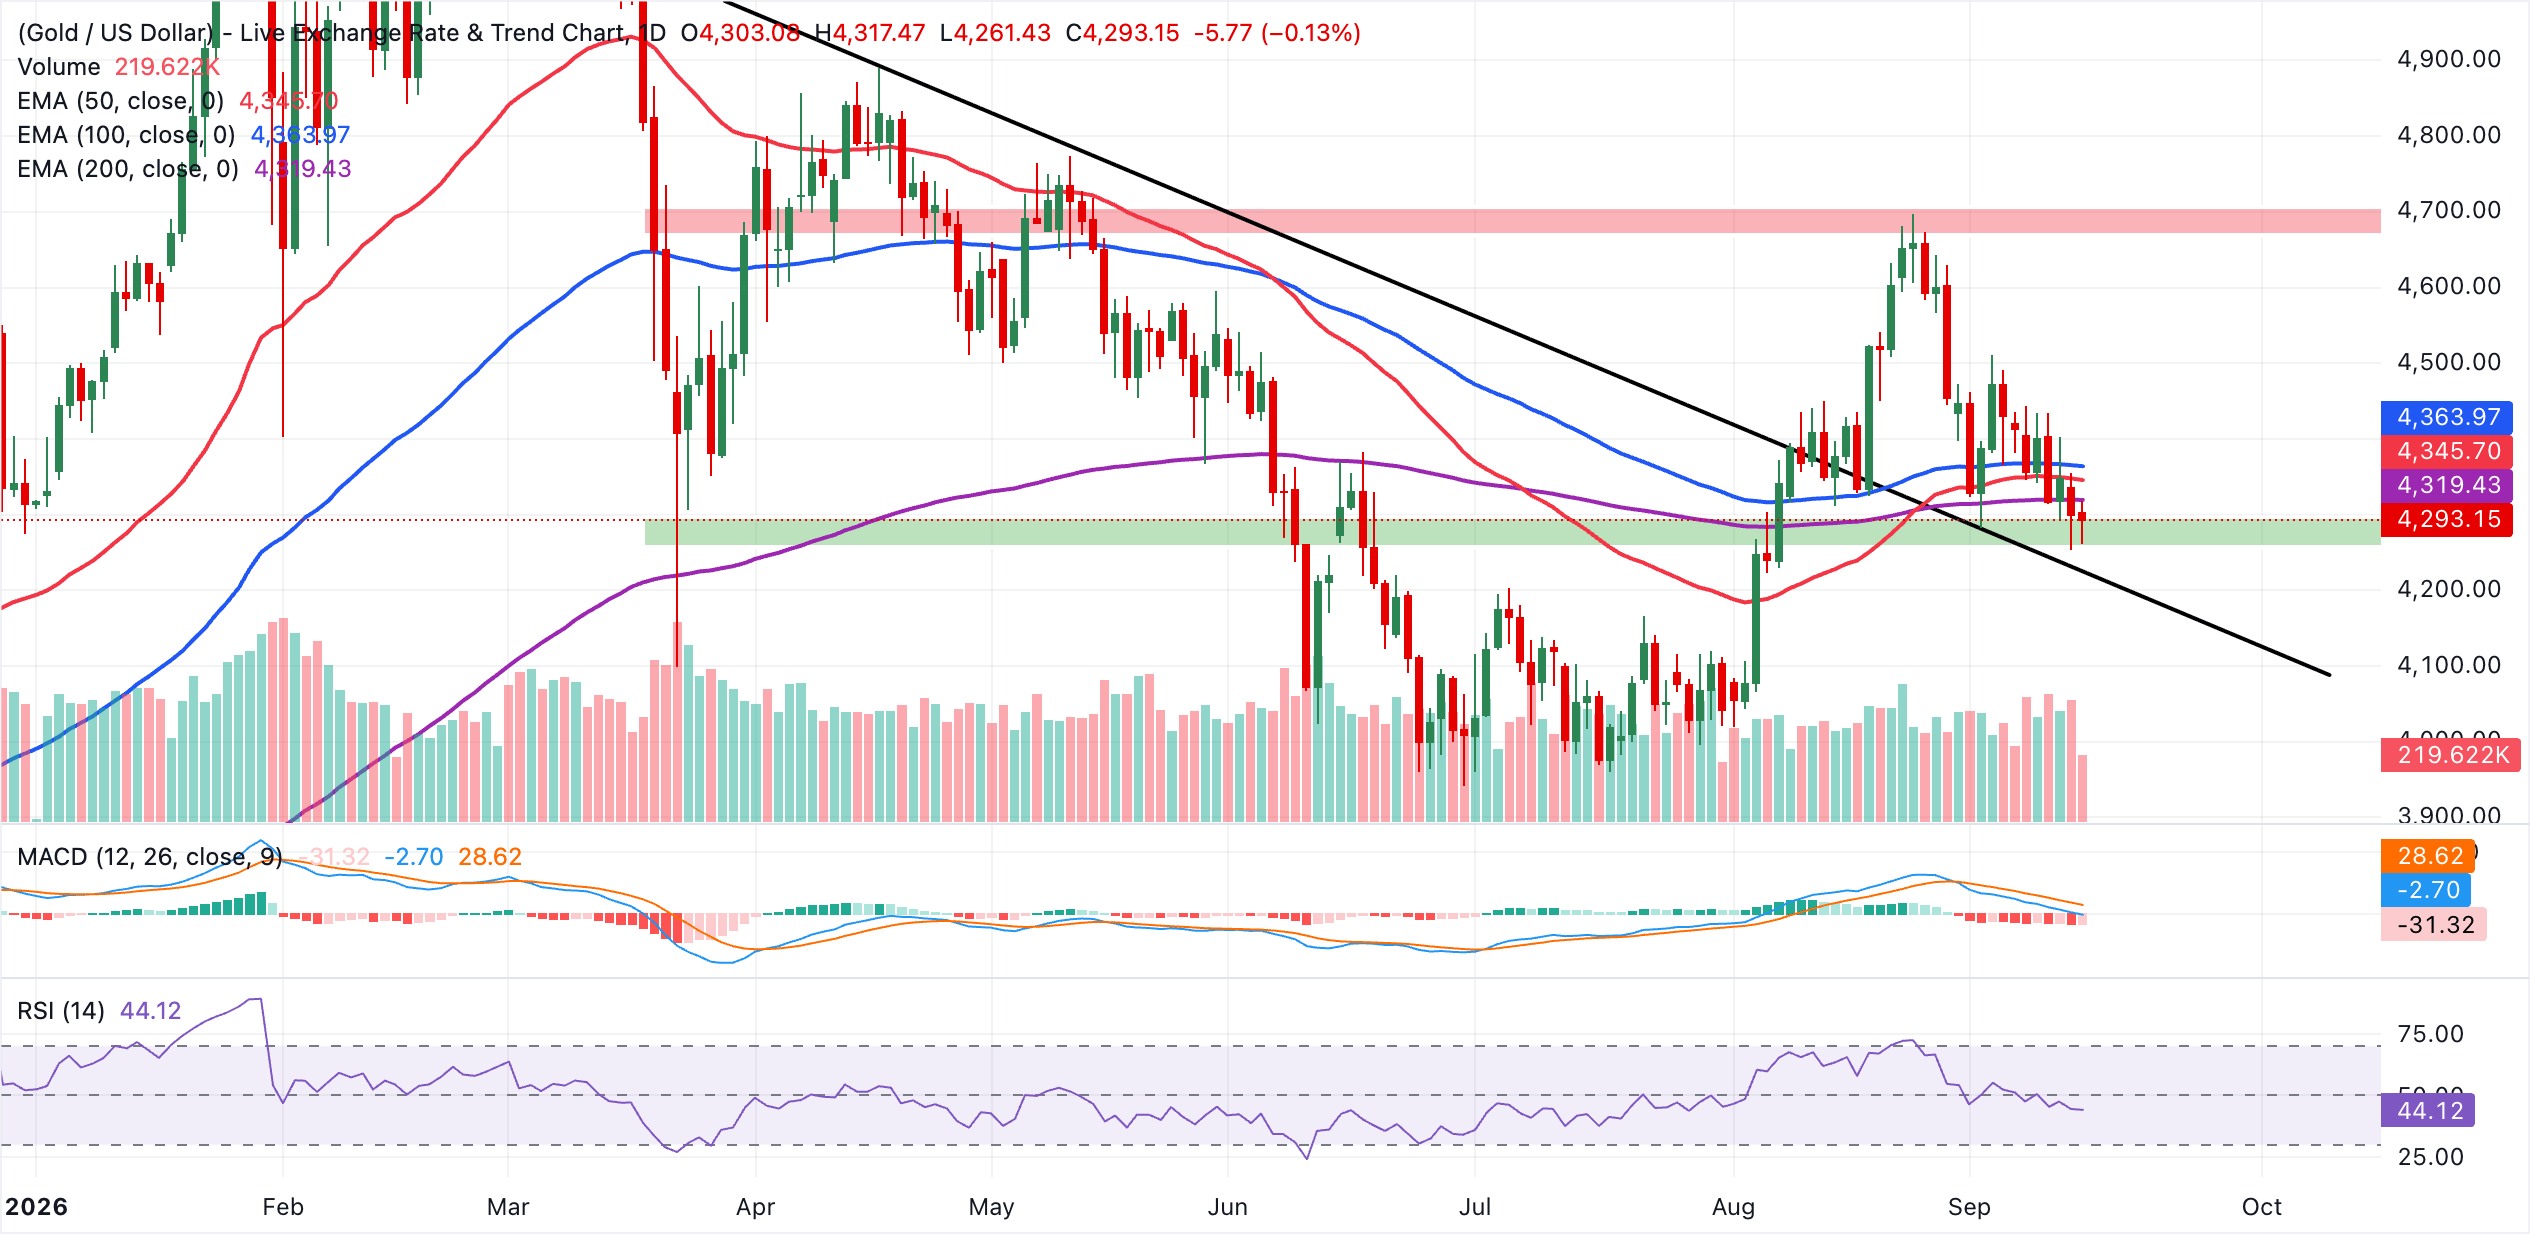
Initial resistance emerges at the 200-day EMA around $4,319, ahead of the 50-day EMA near $4,346 and the 100-day EMA close to $4,364, forming a dense overhead supply zone that bulls would need to reclaim to ease selling pressure. On the downside, the prior downward resistance trendline now offers structural support around $4,187. A sustained move above the EMA cluster would be needed to shift the bias away from the current bearish tone.
(The technical analysis of this story was written with the help of an AI tool. Know more.)
Bitcoin, altcoins, stablecoins FAQs
Bitcoin is the largest cryptocurrency by market capitalization, a virtual currency designed to serve as money. This form of payment cannot be controlled by any one person, group, or entity, which eliminates the need for third-party participation during financial transactions.
Altcoins are any cryptocurrency apart from Bitcoin, but some also regard Ethereum as a non-altcoin because it is from these two cryptocurrencies that forking happens. If this is true, then Litecoin is the first altcoin, forked from the Bitcoin protocol and, therefore, an “improved” version of it.
Stablecoins are cryptocurrencies designed to have a stable price, with their value backed by a reserve of the asset it represents. To achieve this, the value of any one stablecoin is pegged to a commodity or financial instrument, such as the US Dollar (USD), with its supply regulated by an algorithm or demand. The main goal of stablecoins is to provide an on/off-ramp for investors willing to trade and invest in cryptocurrencies. Stablecoins also allow investors to store value since cryptocurrencies, in general, are subject to volatility.
Bitcoin dominance is the ratio of Bitcoin's market capitalization to the total market capitalization of all cryptocurrencies combined. It provides a clear picture of Bitcoin’s interest among investors. A high BTC dominance typically happens before and during a bull run, in which investors resort to investing in relatively stable and high market capitalization cryptocurrency like Bitcoin. A drop in BTC dominance usually means that investors are moving their capital and/or profits to altcoins in a quest for higher returns, which usually triggers an explosion of altcoin rallies.










