
News & AnalysisCareer

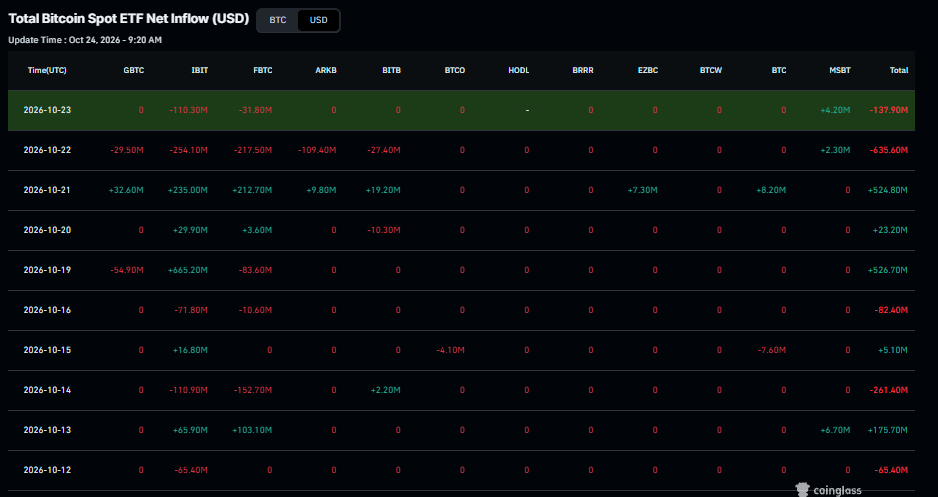
Net inflows into spot Exchange Traded Funds (ETFs) reached $301.2 million last week, ending two consecutive weeks of outflows and signalling a tentative revival in institutional demand. Bitcoin (BTC), however, trades near $80,500 at the time of writing on Monday, having extended its correction into a third successive week.

Pressure on the Crypto King persists as higher crude oil prices and intensifying geopolitical tensions in the Middle East heighten inflation worries and restrain risk appetite.
Despite the retreat in prices, last week brought tentative grounds for optimism over institutional demand. CoinGlass data showed net inflows of $301.2 million into Bitcoin spot ETFs, ending a run of two weeks of outflows. The improvement failed to halt BTC’s decline: the price fell over 2% last week, completing three consecutive weeks of correction since early October. Should inflows persist and strengthen this week, they could soften the continuing price slide.
Supply concerns linked to attacks in Saudi Arabia and tensions involving Iran have driven crude oil to its highest level since 15 September. West Texas Intermediate (WTI) reached $103.28 per barrel on Friday.
On Sunday, in the latest development, Yemen’s Iran-backed Houthis pledged to continue attacks on Saudi Arabia’s King Khalid Airport in Riyadh.
With US-Iran negotiations stalled, the geopolitical risk premium remains elevated, exerting additional upward pressure on oil prices. If energy costs stay high, they could intensify inflation worries, weaken appetite for risk and limit BTC’s potential gains.
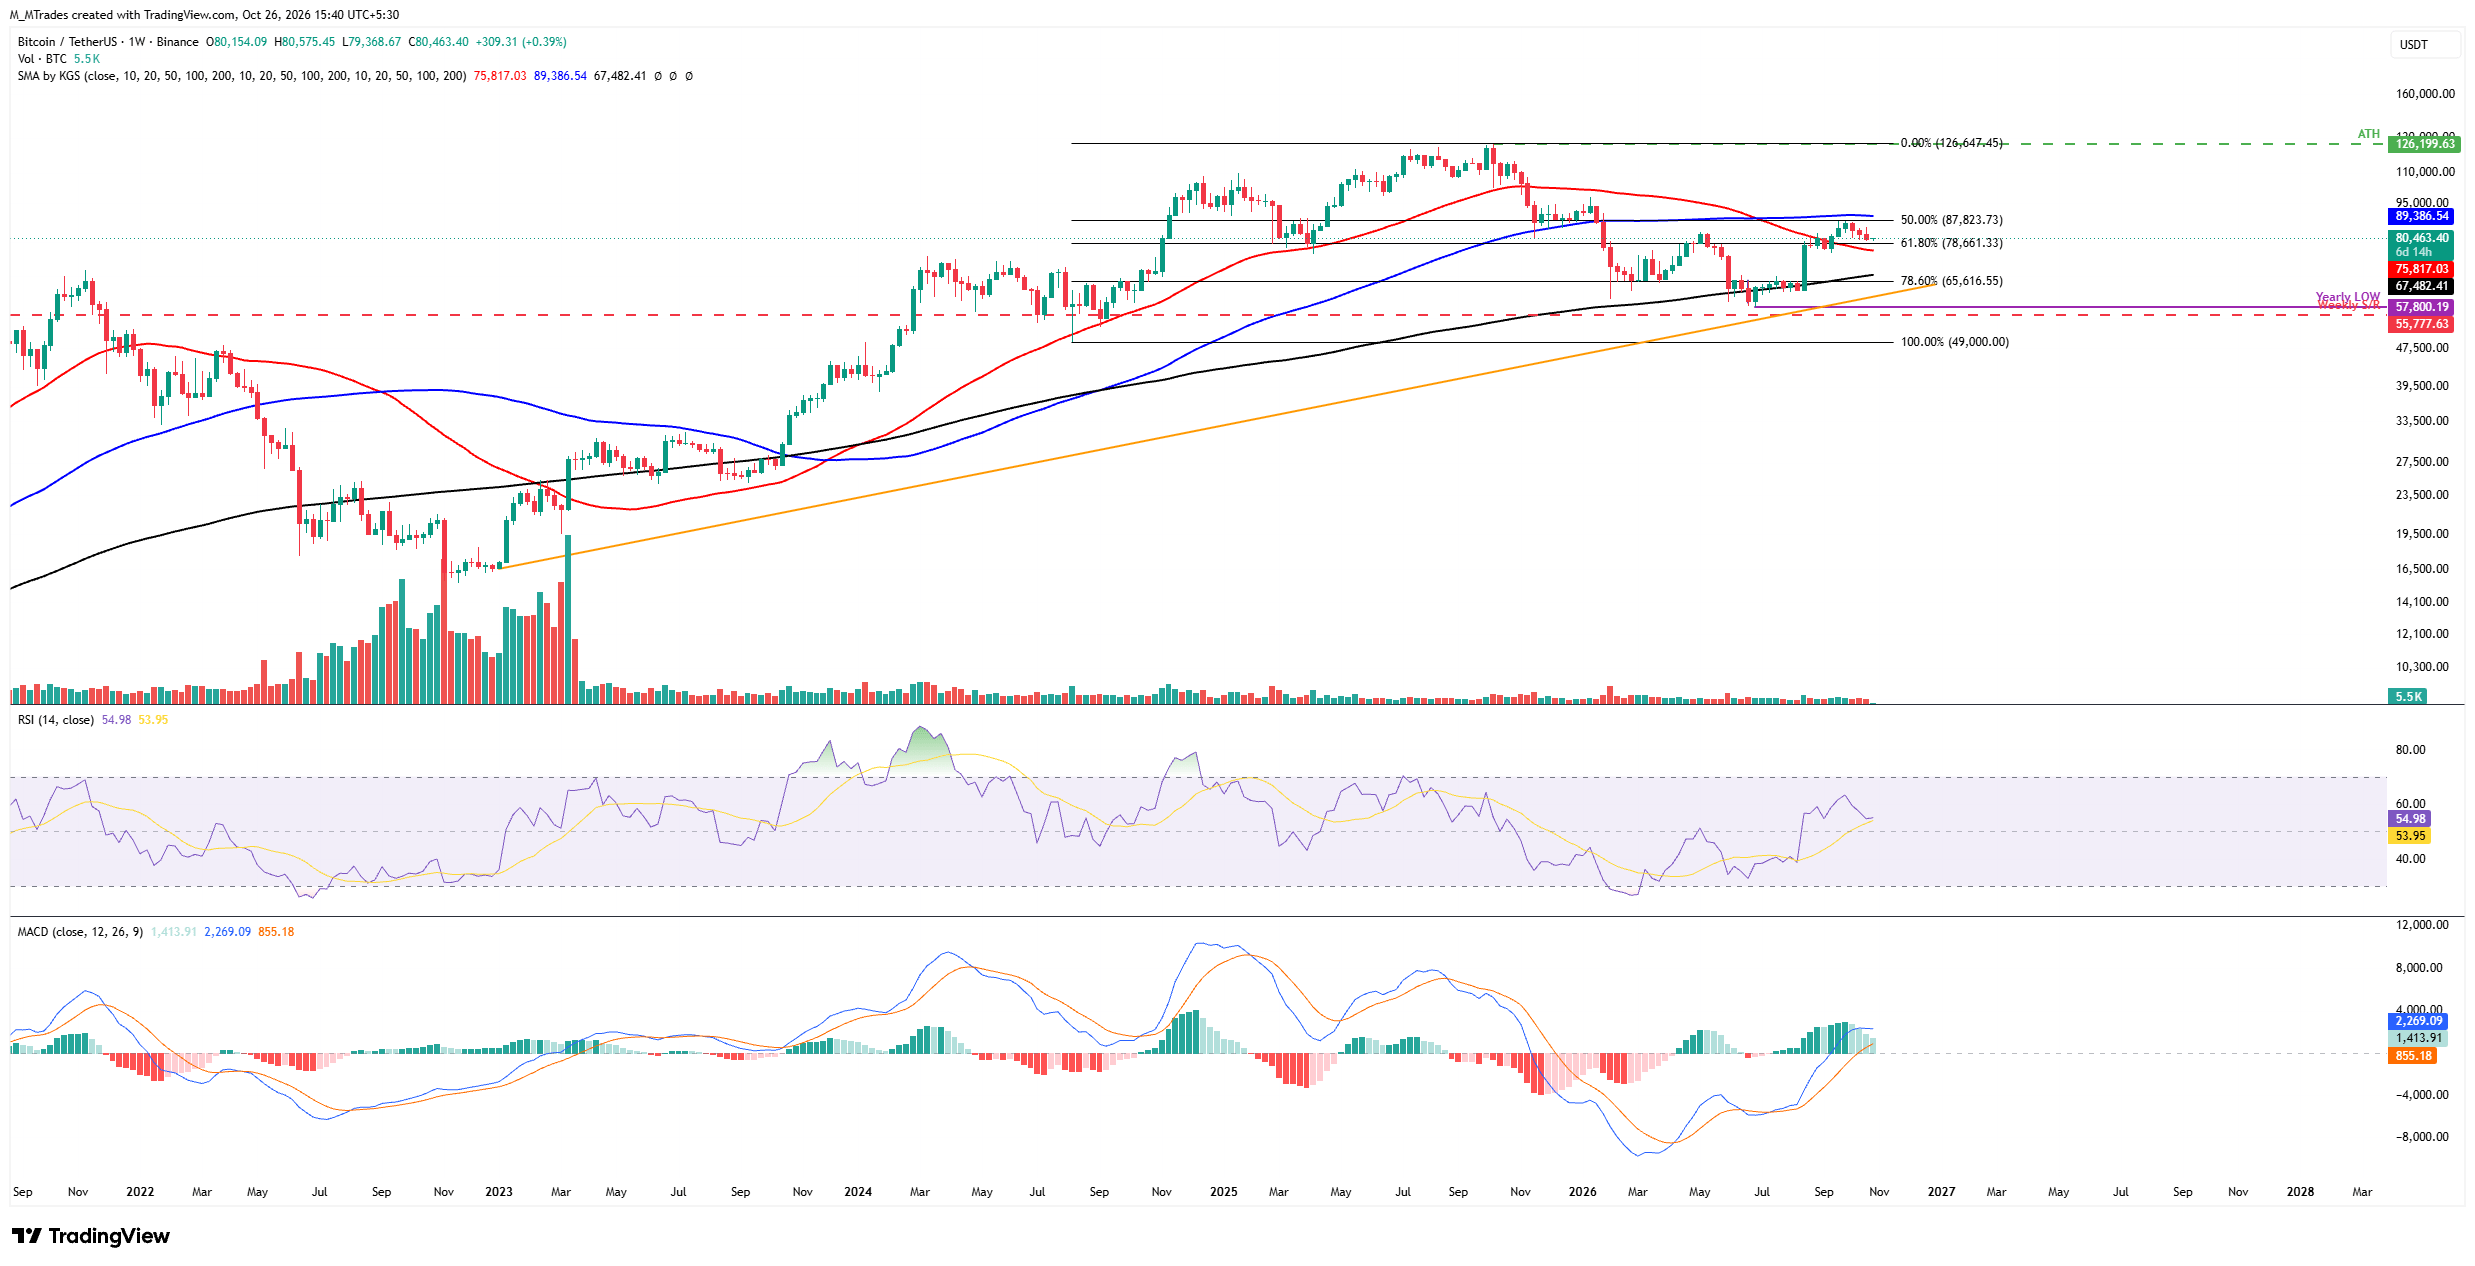
Last week’s 2.39% correction left the Crypto King with a third consecutive weekly loss since early October. On Monday, it trades near $80,400.
A further correction could take BTC towards $78,661, the 61.8% Fibonacci retracement of the rise from the August 2024 low of $49,000 to the October 2025 record high of $126,199. This level broadly coincides with the 50-week Simple Moving Average (SMA) at $75,817.
On the weekly chart, the Relative Strength Index (RSI) is close to 54 and heading down towards the neutral 50 mark, signalling a cooling in bullish momentum. The Moving Average Convergence Divergence (MACD) histogram, meanwhile, is still positive, but its bars are diminishing. The broader upward momentum therefore remains intact, although nearby resistance and the continuing pullback are eroding its strength.
Conversely, a recovery in BTC could carry the price towards the 50% retracement at $87,823, followed by the 100-week SMA at $89,386.
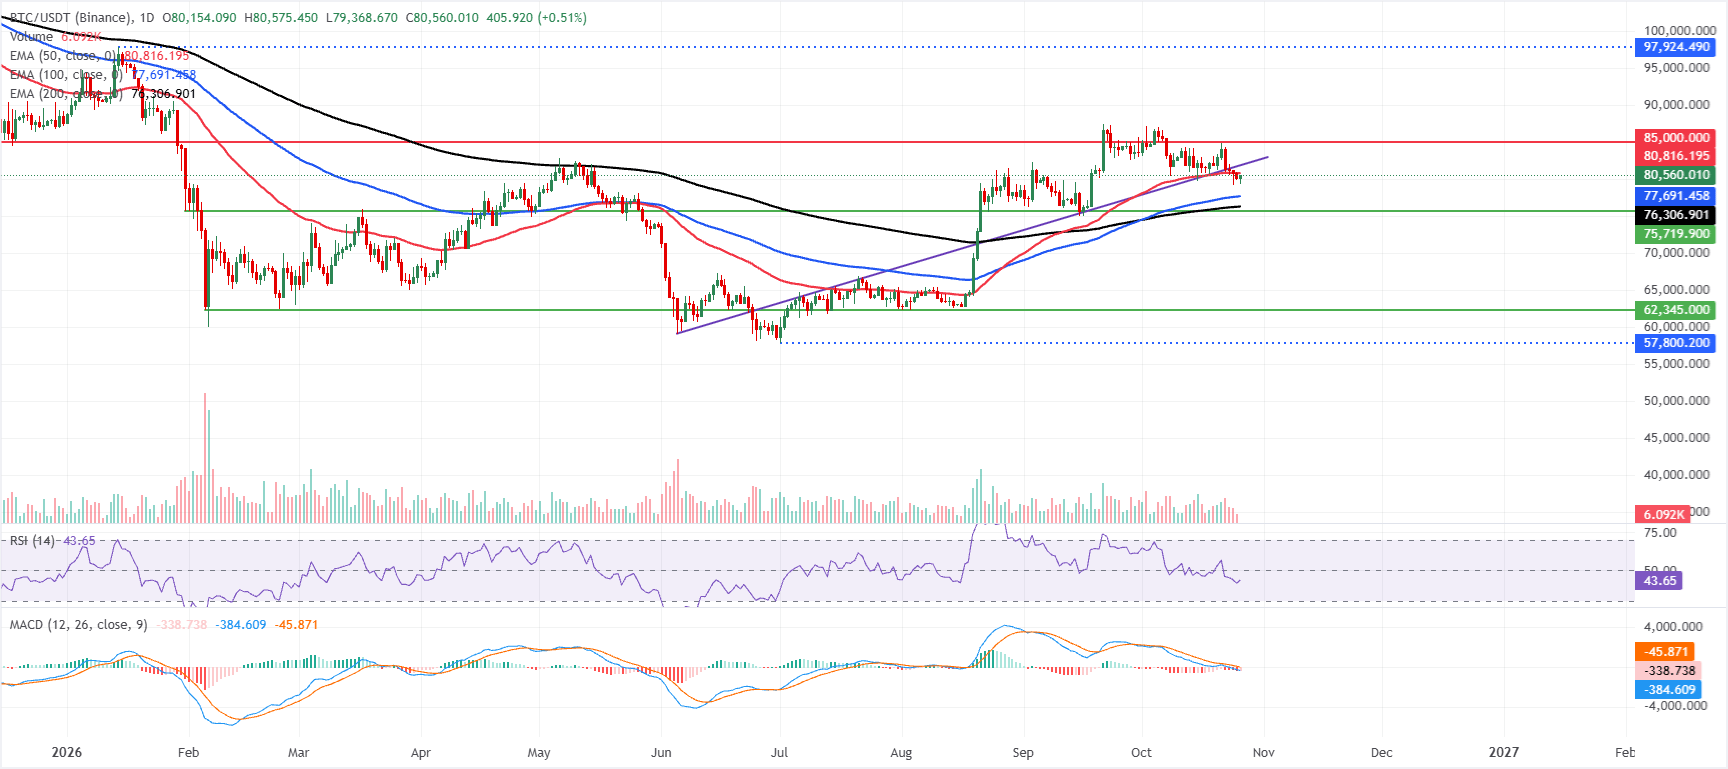
BTC’s daily chart presents a neutral consolidation pattern. The price holds above the 100-day and 200-day Exponential Moving Averages (EMAs), at $77,691 and $76,306 respectively, while the 50-day EMA at $80,816 continues to cap gains. Trading between these trend indicators points to a broadly bullish backdrop, tempered by short-term hesitation. A daily RSI reading of 43 indicates waning momentum, while the MACD’s position below zero also suggests limited bullish impetus.
The first resistance on the upside lies at the 50-day EMA of $80,816. Beyond that, the horizontal level near $85,000 presents a firmer obstacle, where earlier selling pressure could return.
Initial downside support lies at the 100-day EMA of $77,691, followed by a deeper structural floor at the 200-day EMA near $76,306. A daily close beneath these underlying averages would probably shift the short-term outlook back towards a more bearish stance.
(The technical analysis of this story was written with the help of an AI tool. Know more.)
By market capitalisation, Bitcoin ranks as the largest cryptocurrency. It is a virtual currency intended to function as money. No single individual, group or entity can control this payment method, removing the need for third parties to participate in financial transactions.
The term altcoin covers any cryptocurrency other than Bitcoin. Some also exclude Ethereum, however, on the grounds that forks originate from these two cryptocurrencies. Under that definition, Litecoin is the first altcoin: it was forked from the Bitcoin protocol and is therefore an “improved” version of it.
Designed for price stability, stablecoins are cryptocurrencies backed by reserves of the assets they represent. Each stablecoin achieves this by pegging its value to a commodity or financial instrument, such as the US Dollar (USD), while an algorithm or demand regulates its supply. Their primary purpose is to give investors a route into and out of cryptocurrency trading and investment. They also provide a means of storing value, as cryptocurrencies are generally subject to volatility.
The ratio of Bitcoin’s market capitalisation to the combined market capitalisation of all cryptocurrencies is known as Bitcoin dominance. This measure offers a clear view of investor interest in Bitcoin. BTC dominance is typically high before and during a bull run, when investors favour relatively stable cryptocurrencies with large market capitalisations, such as Bitcoin. When BTC dominance falls, it generally signals that investors are shifting capital and/or profits into altcoins in pursuit of greater returns, usually sparking a surge in altcoin rallies.










The information provided on this website is of a general nature only and does not constitute personal financial advice. Before acting on any information on this website, you should consider the suitability of the information in relation to your objectives, financial situation and needs. Investing in CFDs and FX Margin Contracts carries significant risks and is not suitable for all investors. You may lose more than your initial deposit. You do not own, or have, any interest in the underlying asset. We recommend that you seek independent advice and ensure you fully understand the risks involved before trading. It is important that you read and consider the disclosure document before you acquire any product listed on the website. The information and advertisements offered on this website are not intended for use by any person in any country or jurisdiction where such use would be contrary to local laws and regulations. The Products and Services offered on this website are not intended for residents of the United States, Malaysia and Thailand.
TMGM is authorized and regulated in various jurisdictions.
Trademax Australia Limited, trading as TMGM, is regulated by the Australian Securities and Investments Commission (ASIC), AFSL no. 436416 and is located at Level 28, One International Tower, 100 Barangaroo Avenue, 2000 Sydney, NSW Australia.
Email: [email protected]
Trademax Global Limited, trading as TMGM, is authorized and regulated by the Vanuatu Financial Services Commission (VFSC), registration number 40356 and registered at 1276, Kumul Highway, Port Vila, Vanuatu, Republic of Vanuatu.
Email: [email protected]
Trademax Global Markets (SE) Limited, trading as TMGM, is authorized and regulated by the Financial Services Authority (FSA) of Seychelles, with license number SD224. The company is registered at Office No 13, Providence Estate ABIS Centre, Mahe, Seychelles.
Email: [email protected]
Trademax Global Markets (International) Pty Ltd, trading as TMGM, is authorized and regulated by the Financial Services Commission, Mauritius (FSC) with license no. GB22201012, and registered at 33, Edith Cavell Street C/o IQ EQ Fund Services (Mauritius) Ltd Port Louis, 11324 Mauritius.
Email: [email protected]
Copyright © TMGM. All rights reserved

