

EUR/USD Price Forecast: Bulls test 1.1700 as RSI turns overbought
- EUR/USD heads for a fourth consecutive weekly gain despite erasing its earlier intraday advance.
- The pair holds above all key daily moving averages, keeping the near-term outlook bullish.
- Positive MACD momentum supports buyers, although an overbought RSI warns of a possible pullback.
EUR/USD heads for a fourth consecutive weekly gain on Friday, although it has erased its earlier intraday advance. At the time of writing, the pair trades around 1.1682 after briefly rising above 1.1700, its highest level since May 14.

Strategists at Scotiabank note that the “solid gains in the EUR this week largely reflect a broadly lower USD.” They add that “front-end spreads have narrowed considerably since the end of June, supporting the fundamental improvement in the EUR in recent weeks.” From a technical perspective, Scotiabank describes the near-term tone as “bullish—EUR secured a clear extension through the 1.1625/50 zone which has strengthened the prospect of gains pushing on to the mid/upper-1.17s in the short run.”
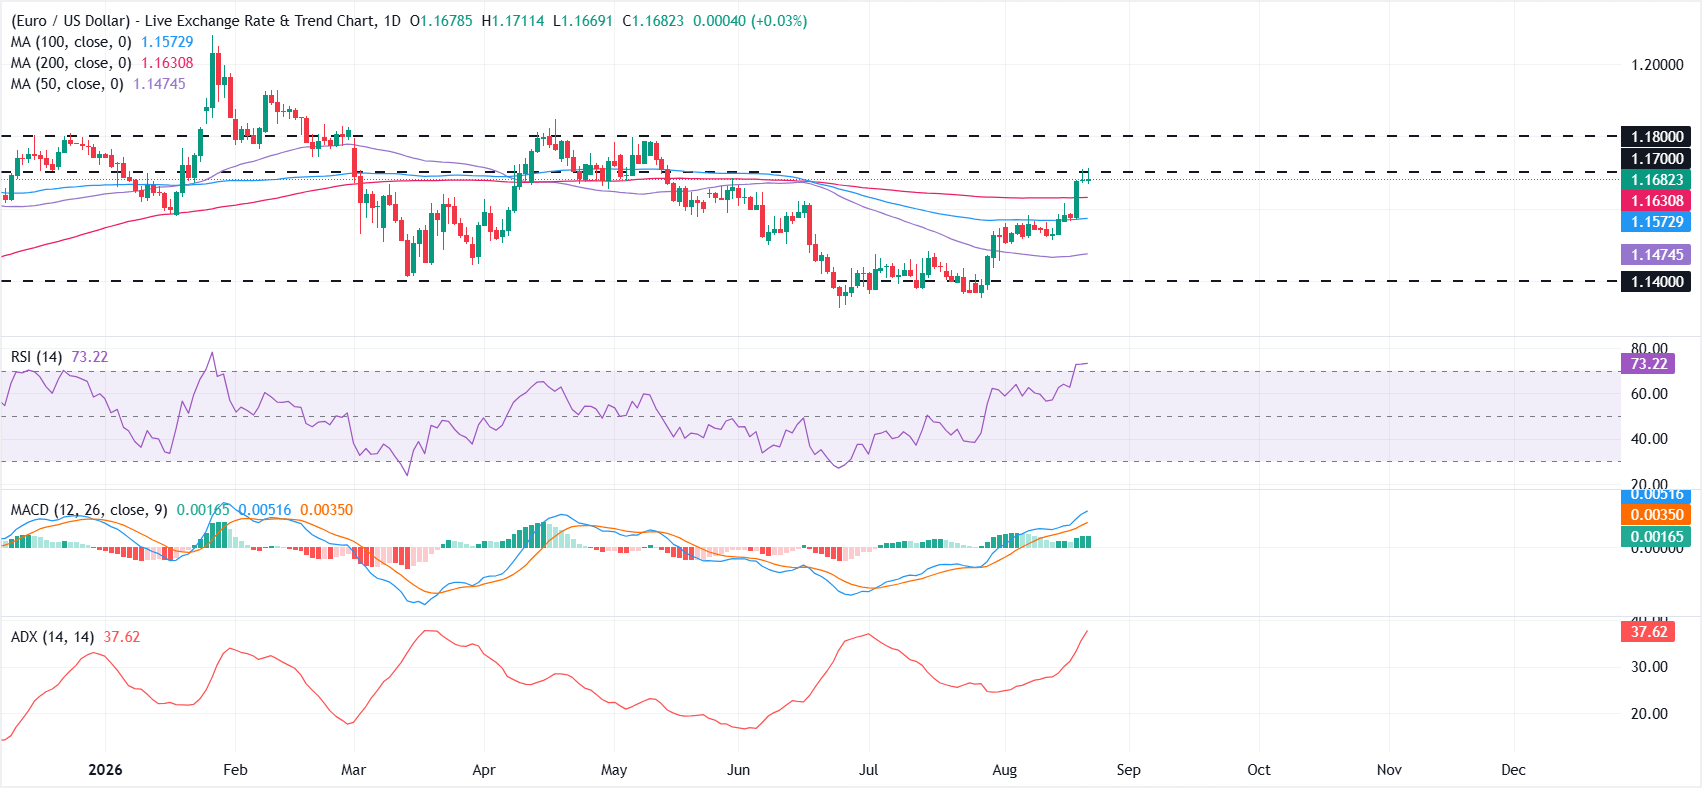
From a technical perspective, the near-term outlook remains bullish as EUR/USD has reclaimed the 50-day, 100-day and 200-day Simple Moving Averages (SMAs) in recent weeks. These averages are clustered between roughly 1.1475 and 1.1631, although momentum indicators suggest that the latest advance is becoming stretched.
The Moving Average Convergence Divergence (MACD) indicator remains in positive territory, pointing to constructive momentum. However, the Relative Strength Index (RSI) stands near 73, signalling overbought conditions that could limit immediate upside.
On the topside, initial resistance emerges at the horizontal barrier near 1.1700, ahead of the 1.1800 mark. On the downside, initial support is provided by the 200-day SMA around 1.1631, followed by the 100-day SMA at 1.1573 and the 50-day SMA near 1.1475. A deeper pullback could expose the horizontal floor at 1.1400.
(The technical analysis of this story was written with the help of an AI tool. Know more.)
Euro Price Today
The table below shows the percentage change of Euro (EUR) against listed major currencies today. Euro was the strongest against the Swiss Franc.
| USD | EUR | GBP | JPY | CAD | AUD | NZD | CHF | |
|---|---|---|---|---|---|---|---|---|
| USD | -0.01% | -0.11% | -0.02% | -0.21% | -0.89% | -0.63% | 0.11% | |
| EUR | 0.01% | -0.10% | -0.02% | -0.23% | -0.89% | -0.60% | 0.11% | |
| GBP | 0.11% | 0.10% | 0.09% | -0.13% | -0.77% | -0.52% | 0.21% | |
| JPY | 0.02% | 0.02% | -0.09% | -0.19% | -0.86% | -0.63% | 0.12% | |
| CAD | 0.21% | 0.23% | 0.13% | 0.19% | -0.68% | -0.41% | 0.30% | |
| AUD | 0.89% | 0.89% | 0.77% | 0.86% | 0.68% | 0.26% | 0.99% | |
| NZD | 0.63% | 0.60% | 0.52% | 0.63% | 0.41% | -0.26% | 0.75% | |
| CHF | -0.11% | -0.11% | -0.21% | -0.12% | -0.30% | -0.99% | -0.75% |
The heat map shows percentage changes of major currencies against each other. The base currency is picked from the left column, while the quote currency is picked from the top row. For example, if you pick the Euro from the left column and move along the horizontal line to the US Dollar, the percentage change displayed in the box will represent EUR (base)/USD (quote).










