
News & AnalysisCareer

Pi Network (PI) hovers around $0.0870 at press time, holding steady after five consecutive days of decline. The network upgrade to the v28 protocol on the testnet brings the ecosystem a step closer to mainnet adoption. The technical outlook for PI remains bearish as downside momentum persists.

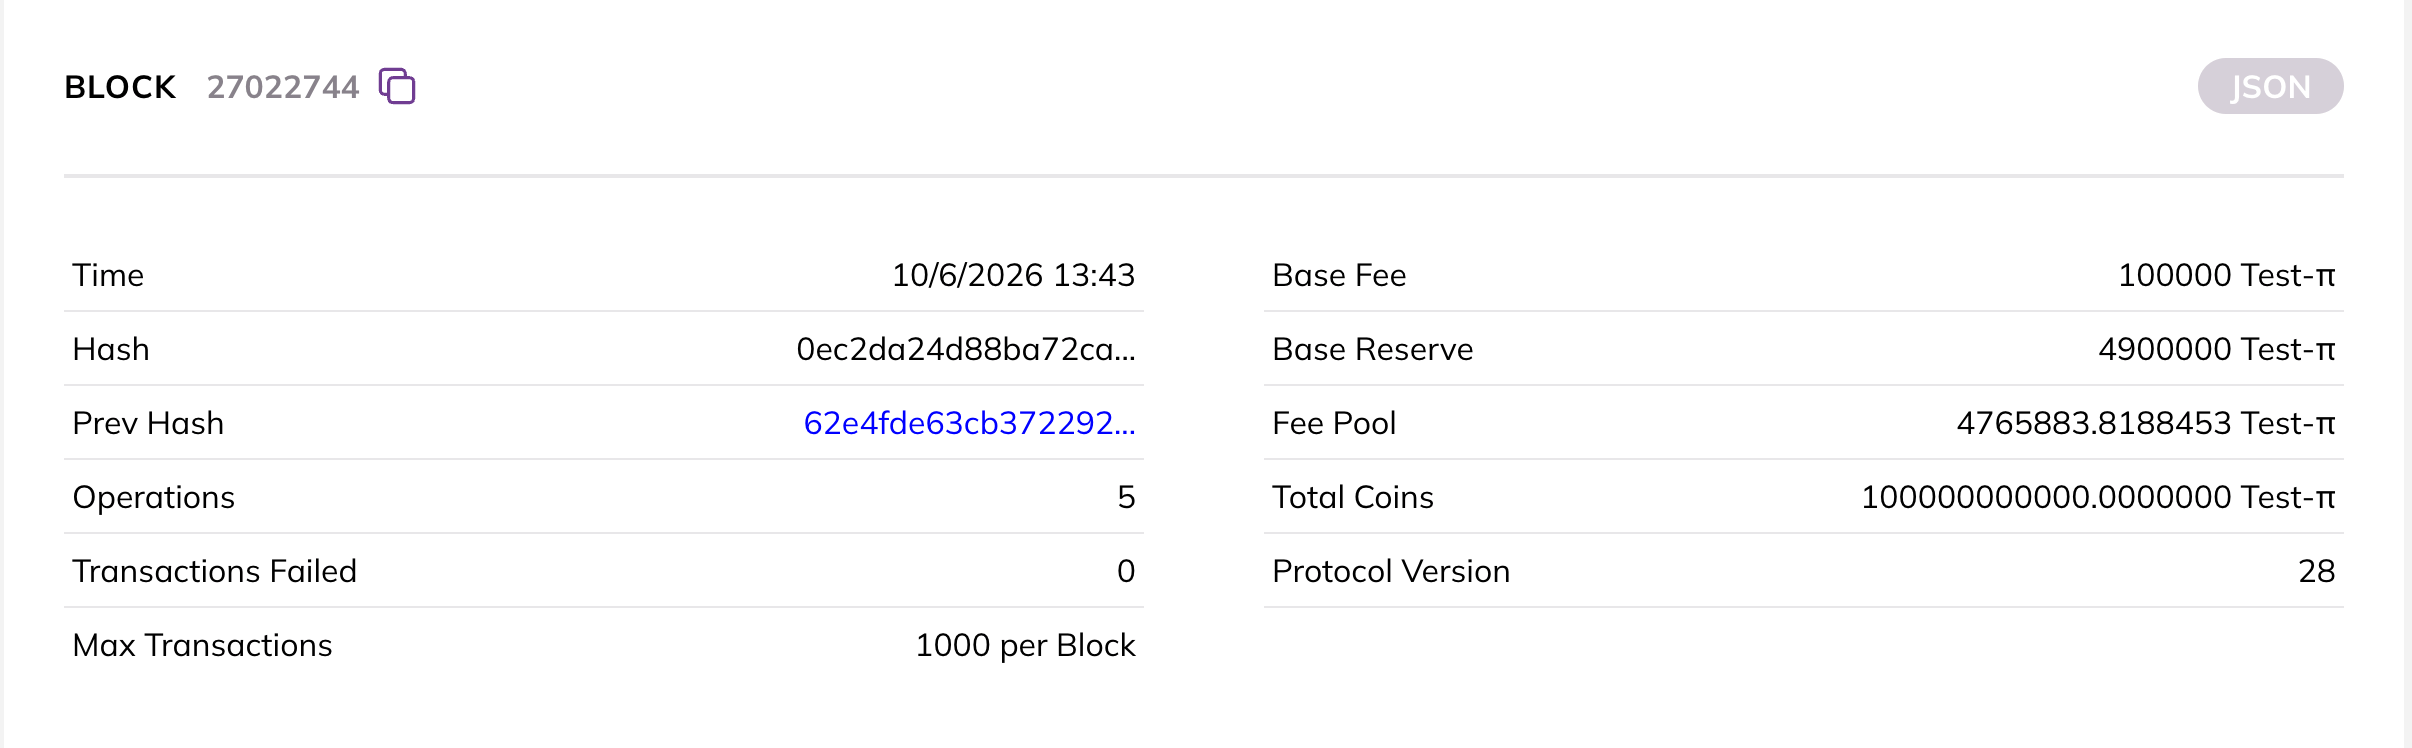
Pi Network’s testnet explorer confirms that the latest blocks are settled on protocol version 28 following the recent mainnet upgrade to v27. This positions the mainnet for the next upgrade, which will improve the network's handling of delays in transaction data and enable developers to upgrade groups of smart contracts at once and to change stored data more safely as their applications develop.
Pi Node operators have until October 13 to update their nodes to support the mainnet protocol 28 upgrade on October 16.
Pi Network hovers around $0.0874 at press time on Tuesday, maintaining a bearish bias. The PI token price remains below the 50-day, 100-day, and 200-day Exponential Moving Averages (EMAs) at $0.0909, $0.0988, and $0.1215, respectively. This alignment of descending EMAs suggests rallies are likely to be capped by overhead supply.
Momentum on the daily chart shows a corrective bias, with the Relative Strength Index (RSI) near 45, crossing below its midline as downside momentum gains traction. At the same time, the Moving Average Convergence Divergence (MACD) declines below zero and the signal line, reinforcing a bearish bias.
On the downside, immediate structural support is at the 23.6% Fibonacci retracement level of $0.0866, measured from $0.1341 to $0.0704, with a deeper floor at the $0.0704 swing low if selling pressure intensifies.
On the topside, initial resistance emerges at the 50-day EMA at $0.0909, followed by the 100-day EMA at $0.0988. A sustained break above this clustered band would be needed to ease bearish pressure and open the way toward the 50% retracement at $0.1049.
(The technical analysis of this story was written with the help of an AI tool. Know more.)










The information provided on this website is of a general nature only and does not constitute personal financial advice. Before acting on any information on this website, you should consider the suitability of the information in relation to your objectives, financial situation and needs. Investing in CFDs and FX Margin Contracts carries significant risks and is not suitable for all investors. You may lose more than your initial deposit. You do not own, or have, any interest in the underlying asset. We recommend that you seek independent advice and ensure you fully understand the risks involved before trading. It is important that you read and consider the disclosure document before you acquire any product listed on the website. The information and advertisements offered on this website are not intended for use by any person in any country or jurisdiction where such use would be contrary to local laws and regulations. The Products and Services offered on this website are not intended for residents of the United States, Malaysia and Thailand.
TMGM is authorized and regulated in various jurisdictions.
Trademax Australia Limited, trading as TMGM, is regulated by the Australian Securities and Investments Commission (ASIC), AFSL no. 436416 and is located at Level 28, One International Tower, 100 Barangaroo Avenue, 2000 Sydney, NSW Australia.
Email: [email protected]
Trademax Global Limited, trading as TMGM, is authorized and regulated by the Vanuatu Financial Services Commission (VFSC), registration number 40356 and registered at 1276, Kumul Highway, Port Vila, Vanuatu, Republic of Vanuatu.
Email: [email protected]
Trademax Global Markets (SE) Limited, trading as TMGM, is authorized and regulated by the Financial Services Authority (FSA) of Seychelles, with license number SD224. The company is registered at Office No 13, Providence Estate ABIS Centre, Mahe, Seychelles.
Email: [email protected]
Trademax Global Markets (International) Pty Ltd, trading as TMGM, is authorized and regulated by the Financial Services Commission, Mauritius (FSC) with license no. GB22201012, and registered at 33, Edith Cavell Street C/o IQ EQ Fund Services (Mauritius) Ltd Port Louis, 11324 Mauritius.
Email: [email protected]
Copyright © TMGM. All rights reserved

