
News & AnalysisCareer

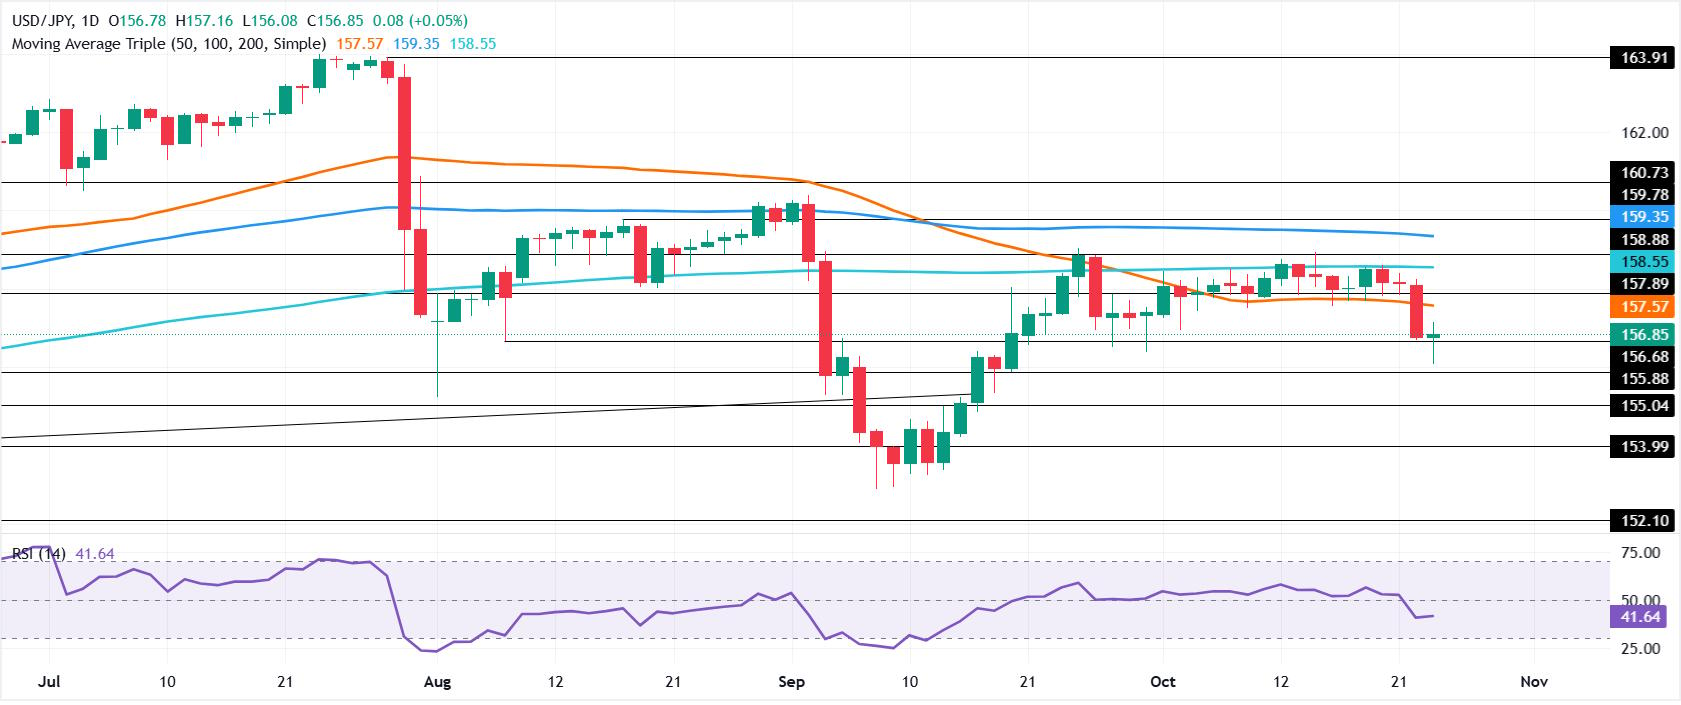
USD/JPY lost over 0.74% over the week, leaving the Japanese Yen stronger, although the pair held steady on the day against a backdrop of subdued market sentiment. Trading at 156.85, the pair is developing a ‘hammer candle pattern’.
Further sideways trading looks consistent with the price action as USD/JPY remains confined to the 300-pip range of 156.00-159.00. Neither side has managed a decisive break through the immediate support or resistance marking the range boundaries.
With the 14-day Relative Strength Index (RSI) slipping beneath the neutral 50 level, momentum has turned bearish, signalling that sellers are gaining strength.
The downside therefore remains the path of least resistance, with initial support at the psychological 156.50 level. Below that, the daily low of 156.08 recorded on 23 October comes into view, ahead of the 155.00 milestone targeted by sellers. Should that level give way, the 8 September swing low of 152.89 would be exposed.
For a recovery, USD/JPY first needs to contend with resistance at the 50-day Simple Moving Average (SMA) of 157.57. Further gains would bring the 100-day SMA at 158.50 into focus, ahead of the 200-day SMA at 159.35.
The Japanese Yen recorded its strongest performance against the US Dollar this week. The table below sets out the percentage changes in the Japanese Yen (JPY) against the major currencies listed.
| USD | EUR | GBP | JPY | CAD | AUD | NZD | CHF | |
|---|---|---|---|---|---|---|---|---|
| USD | -0.15% | -0.46% | -0.77% | -0.81% | -1.12% | -0.74% | -0.14% | |
| EUR | 0.15% | -0.31% | -0.56% | -0.61% | -0.88% | -0.58% | 0.03% | |
| GBP | 0.46% | 0.31% | -0.25% | -0.30% | -0.56% | -0.26% | 0.41% | |
| JPY | 0.77% | 0.56% | 0.25% | -0.05% | -0.35% | 0.02% | 0.75% | |
| CAD | 0.81% | 0.61% | 0.30% | 0.05% | -0.29% | 0.09% | 0.71% | |
| AUD | 1.12% | 0.88% | 0.56% | 0.35% | 0.29% | 0.30% | 0.94% | |
| NZD | 0.74% | 0.58% | 0.26% | -0.02% | -0.09% | -0.30% | 0.66% | |
| CHF | 0.14% | -0.03% | -0.41% | -0.75% | -0.71% | -0.94% | -0.66% |
Percentage movements between the major currencies are displayed in the heat map. Select the base currency in the left-hand column and the quote currency in the top row. For instance, choosing the Japanese Yen on the left and following its row across to the US Dollar gives the percentage change for JPY (base)/USD (quote) in the corresponding cell.










The information provided on this website is of a general nature only and does not constitute personal financial advice. Before acting on any information on this website, you should consider the suitability of the information in relation to your objectives, financial situation and needs. Investing in CFDs and FX Margin Contracts carries significant risks and is not suitable for all investors. You may lose more than your initial deposit. You do not own, or have, any interest in the underlying asset. We recommend that you seek independent advice and ensure you fully understand the risks involved before trading. It is important that you read and consider the disclosure document before you acquire any product listed on the website. The information and advertisements offered on this website are not intended for use by any person in any country or jurisdiction where such use would be contrary to local laws and regulations. The Products and Services offered on this website are not intended for residents of the United States, Malaysia and Thailand.
TMGM is authorized and regulated in various jurisdictions.
Trademax Australia Limited, trading as TMGM, is regulated by the Australian Securities and Investments Commission (ASIC), AFSL no. 436416 and is located at Level 28, One International Tower, 100 Barangaroo Avenue, 2000 Sydney, NSW Australia.
Email: [email protected]
Trademax Global Limited, trading as TMGM, is authorized and regulated by the Vanuatu Financial Services Commission (VFSC), registration number 40356 and registered at 1276, Kumul Highway, Port Vila, Vanuatu, Republic of Vanuatu.
Email: [email protected]
Trademax Global Markets (SE) Limited, trading as TMGM, is authorized and regulated by the Financial Services Authority (FSA) of Seychelles, with license number SD224. The company is registered at Office No 13, Providence Estate ABIS Centre, Mahe, Seychelles.
Email: [email protected]
Trademax Global Markets (International) Pty Ltd, trading as TMGM, is authorized and regulated by the Financial Services Commission, Mauritius (FSC) with license no. GB22201012, and registered at 33, Edith Cavell Street C/o IQ EQ Fund Services (Mauritius) Ltd Port Louis, 11324 Mauritius.
Email: [email protected]
Copyright © TMGM. All rights reserved


