

Trading
Explore a wide range of markets with competitive pricing, deep liquidity, and advanced trading tools.
Learn More 
Platform
Trade seamlessly with TMGM's powerful platform, built for speed, precision, and a superior trading experience.
Learn More Trading Platform
Academy
Learn the fundamentals of trading with beginner-friendly resources, including guides, webinars, and market insights.
Learn More News & Analysis
Get real-time market updates and expert analysis to stay ahead of trading opportunities
Learn More News & Analysis
About
Learn what sets TMGM apart — our global presence, regulatory strength, and commitment to innovation in trading.
Learn More Why Choose TMGM
Sponsorship
Crypto Today: Bearish momentum gathers pace as Bitcoin, Ethereum and XRP prolong their losing streak
- Selling pressure persists on Bitcoin near $80,000, with immediate support coming from the dynamic SuperTrend line.
- Sellers strengthen their hold on Ethereum before Wednesday's Fed rate decision, extending its decline to a fifth straight day.
- With momentum indicators weakening and gains constrained, XRP edges down below $1.30.
Selling pressure weighs on cryptocurrencies on Monday, with Bitcoin’s (BTC) five-day decline leading the broader correction. Trading near $80,000, the Crypto King continues to face structural limits on further gains. A robust cluster of medium- to long-term moving averages nevertheless supports Bitcoin, suggesting it could absorb pressure from sellers.

Sellers are gaining momentum in Ethereum (ETH) as they seek to maintain control of the trend, with the token edging down towards $2,325. Ripple (XRP), meanwhile, appears to be entering consolidation as supply at $1.30 restricts gains and curbs its recovery prospects.
Why is market sentiment weakening ahead of the Fed decision?
An unchanged interest rate in the 3.75-4.00 range remains the widely anticipated outcome of Wednesday's Federal Reserve (Fed) decision. According to CME Group’s FedWatch Tool, the probability of rates staying steady is roughly 91%, while only 9% of market participants expect an increase.
In September, the Federal Open Market Committee (FOMC) delivered its first interest rate increase in three years, raising rates by 25 basis points. It pointed to persistent inflation and pressure on Oil and energy prices arising from the war in the Middle East.
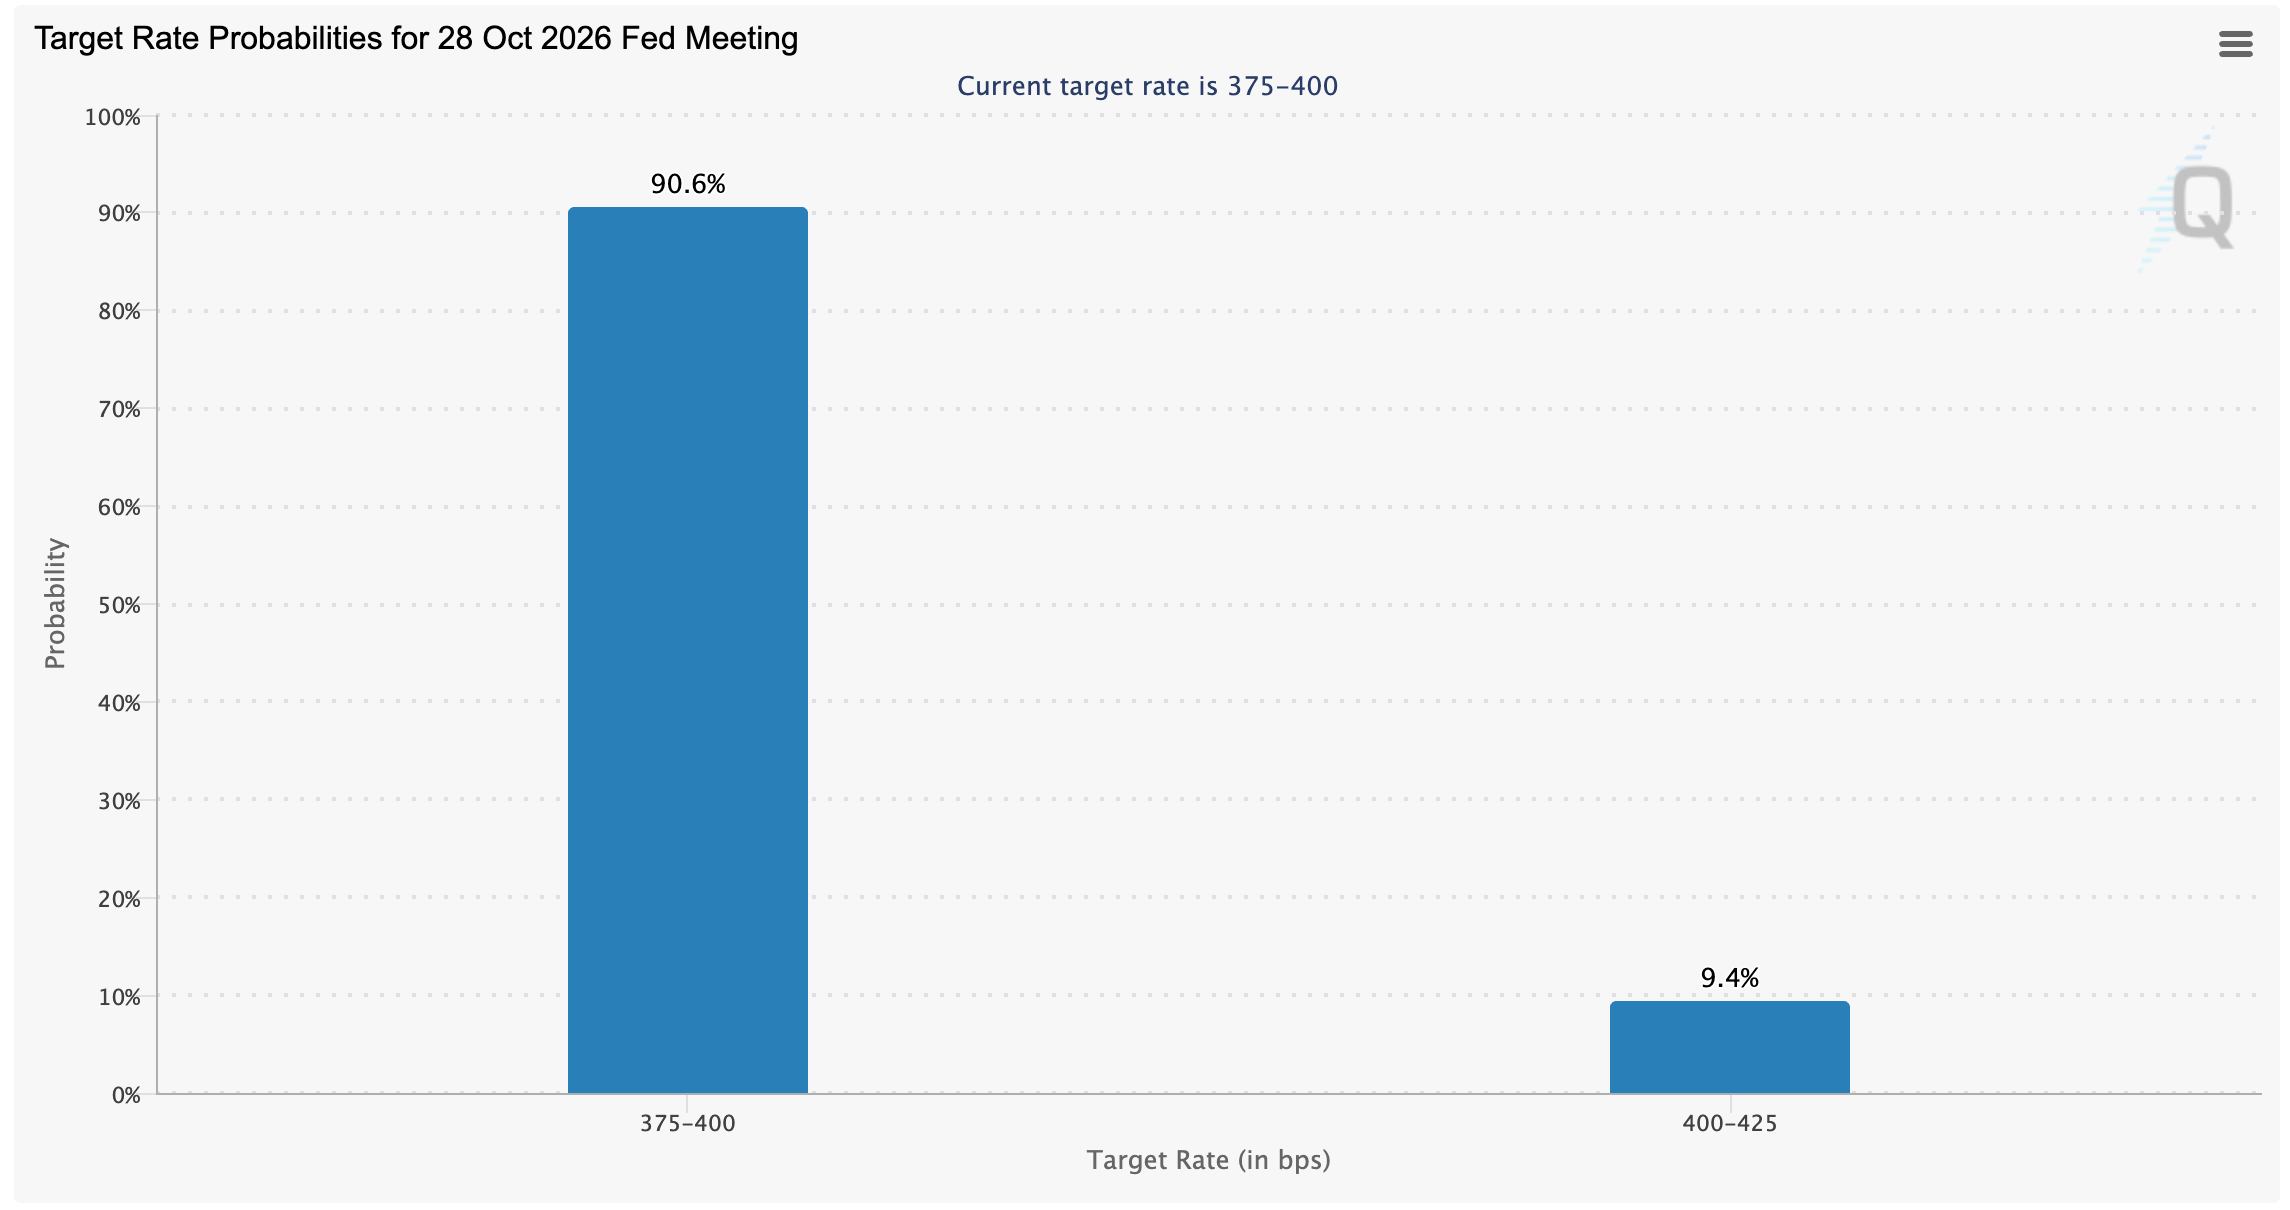
Despite the central bank's determination to meet its long-term inflation target of 2%, price growth in the world’s largest economy remains above that level. Alongside the monetary policy decision, investors will scrutinise Fed Chair Kevin Warsh’s remarks at the post-meeting conference for indications of the policy outlook. Economists are assigning a greater probability to a rate cut in December.
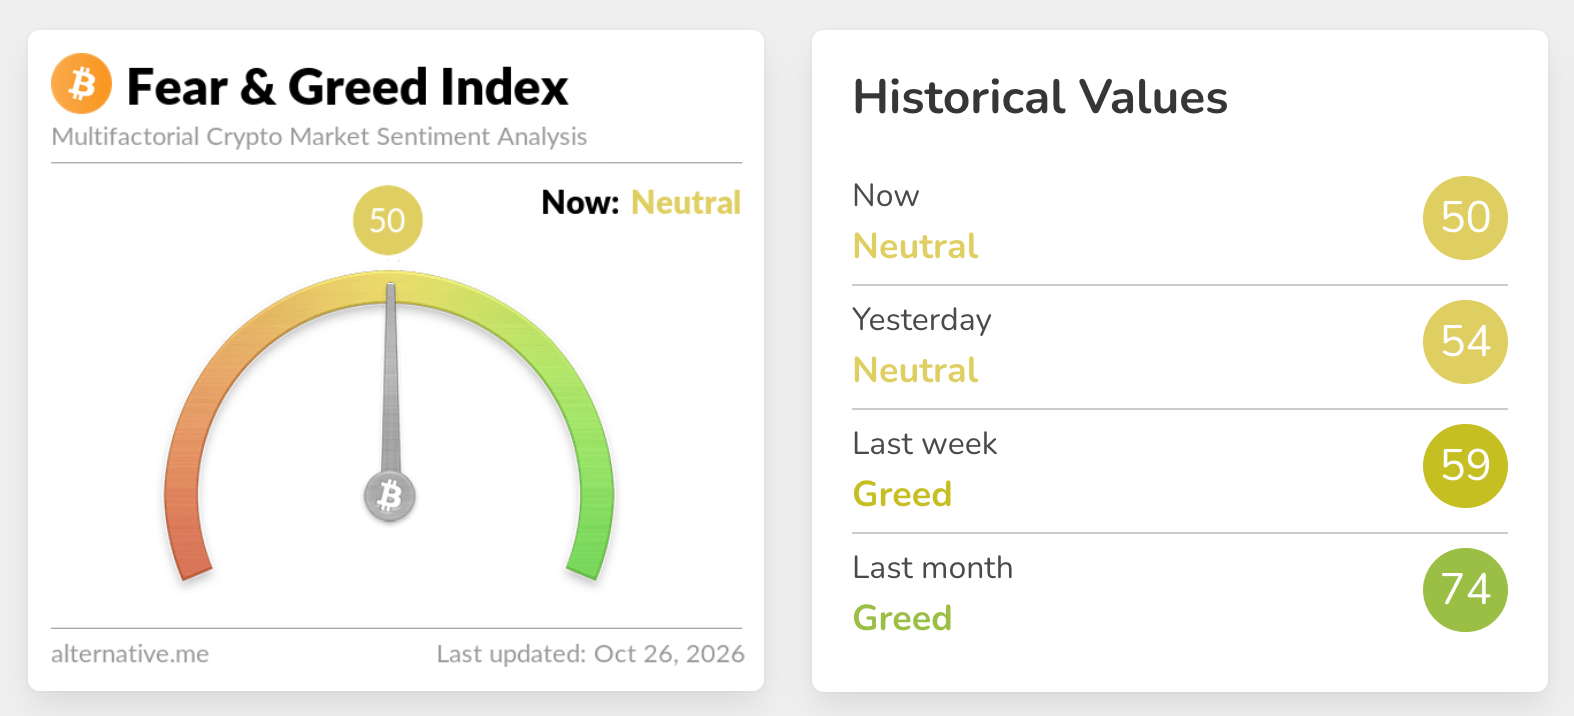
Demand for digital assets has become more subdued before the FOMC meeting. Reflecting that caution, the Crypto Fear & Greed Index stood at 50 within Greed territory on Monday, compared with 54 in the same range a day earlier. The broader retreat from last month’s average of 74 underlines macroeconomic and geopolitical uncertainty, alongside the absence of a sufficiently strong catalyst to sustain demand.
Bitcoin technical analysis: Can sellers maintain their grip?
Holding above the SuperTrend line at $79,664, Bitcoin retains a constructive bullish bias at its current price of $80,061. The longer-term 100-day and 200-day Exponential Moving Averages (EMAs), at $77,681 and $76,322 respectively, also remain below the price. Immediate resistance, however, comes from the 50-day EMA at $80,797, which continues to limit gains. With the Relative Strength Index (RSI) easing to 41 and the Moving Average Convergence Divergence (MACD) histogram in negative territory, the indicators suggest that bullish momentum has weakened and further near-term gains could be harder to achieve.
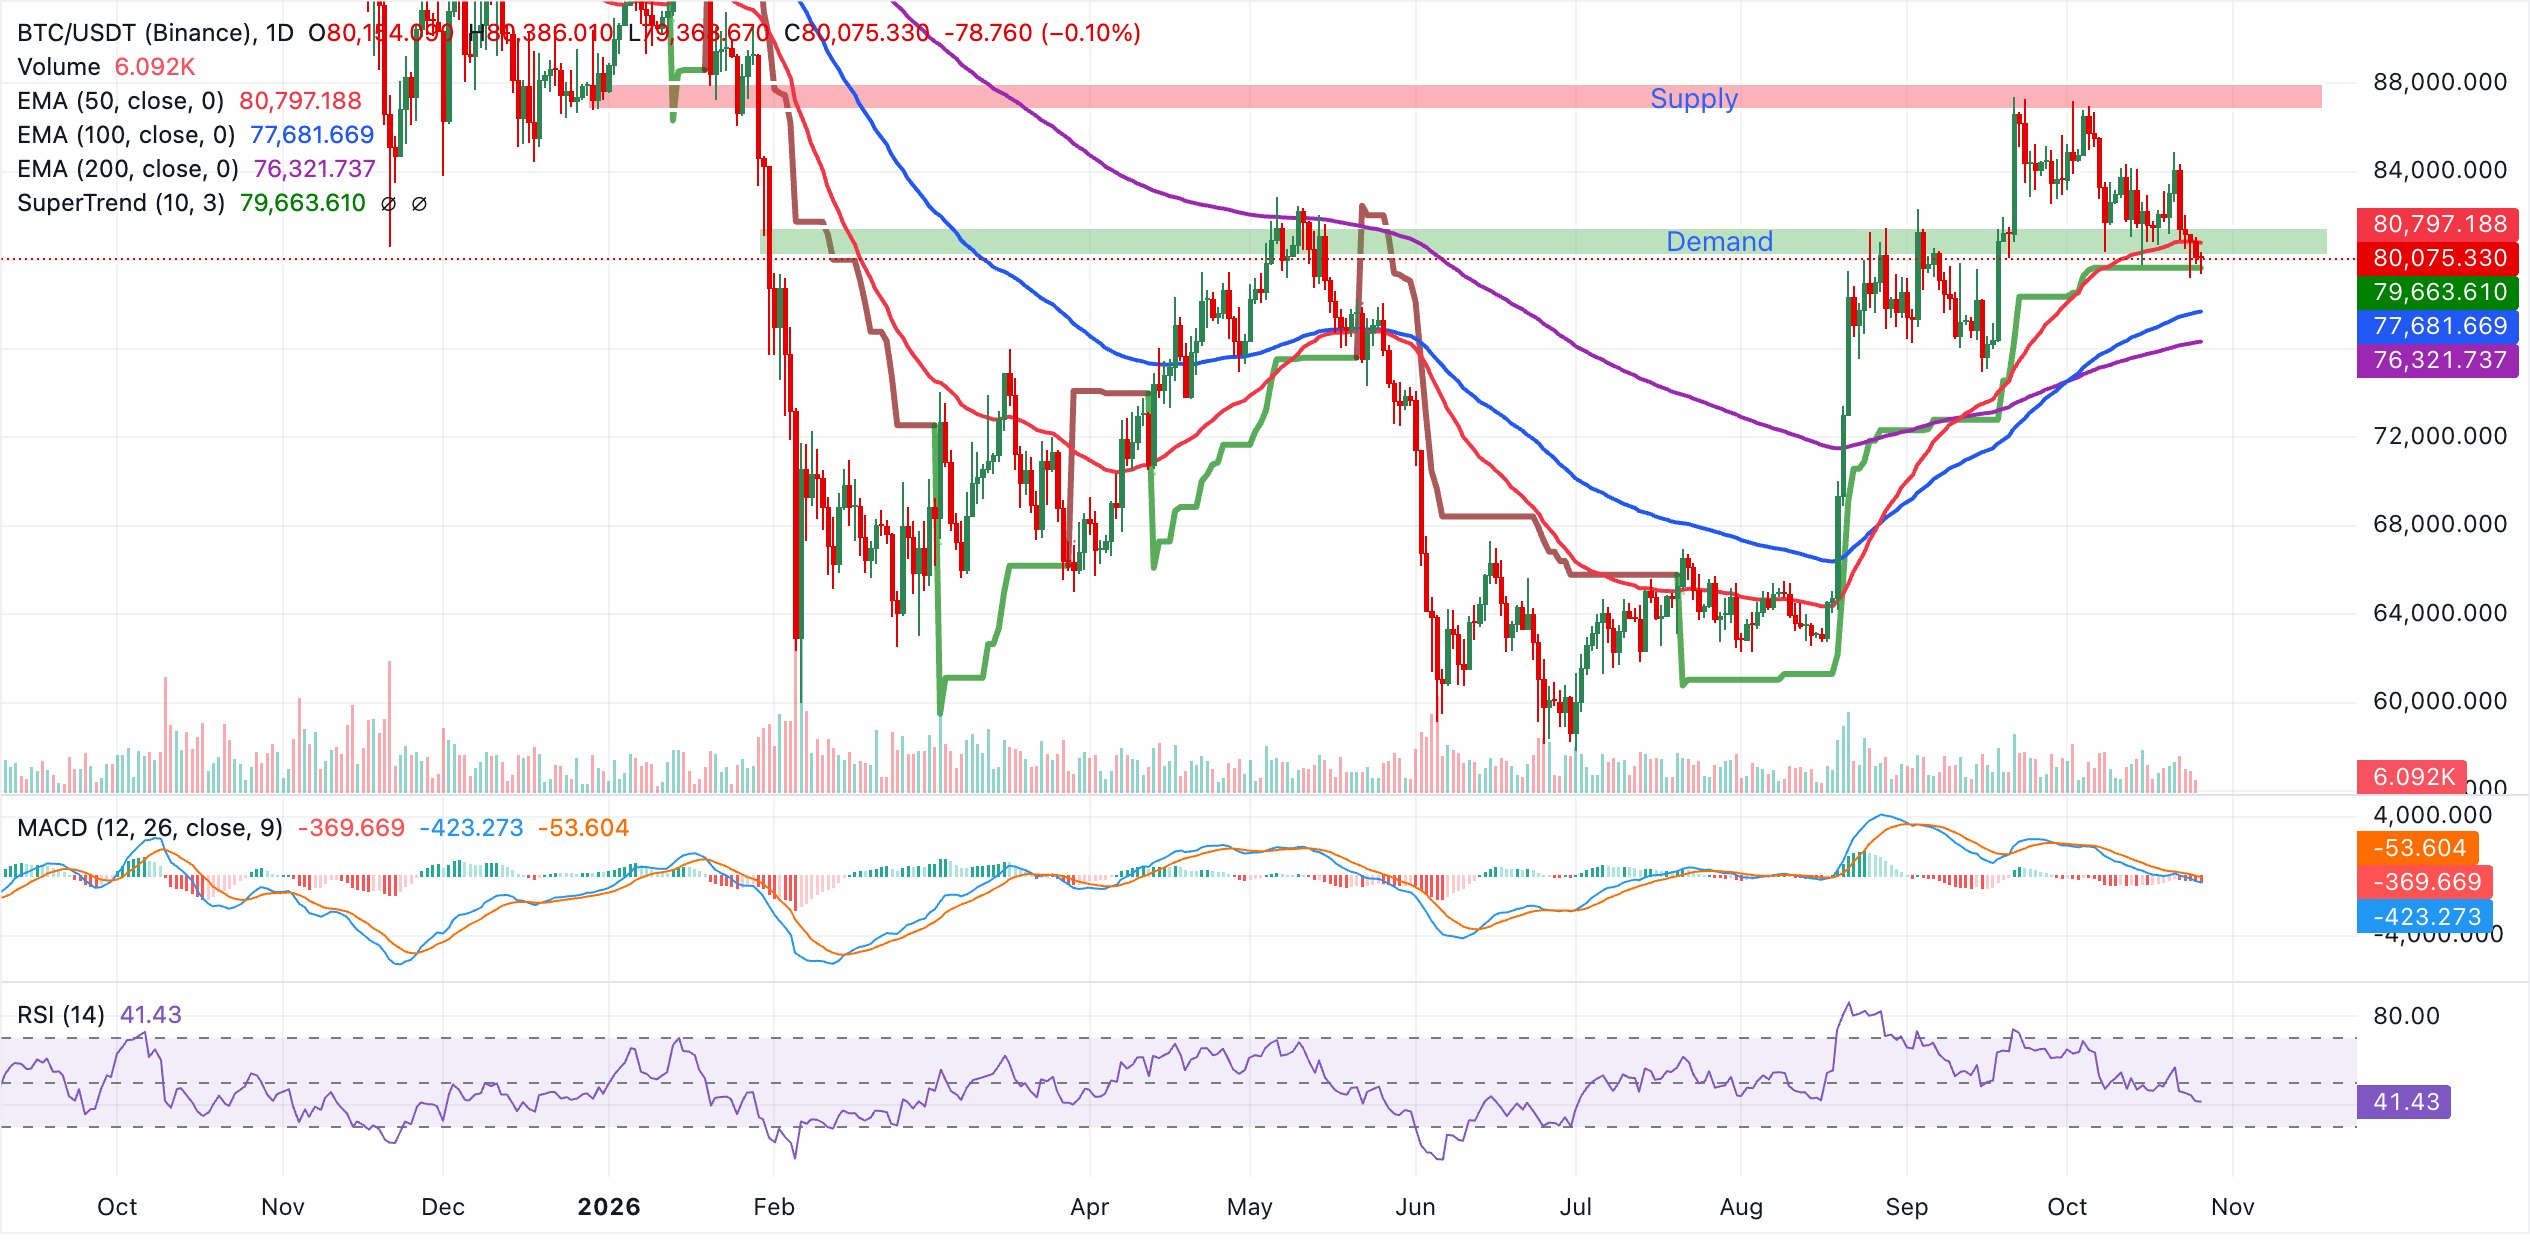
The first support to watch is the SuperTrend line near $79,664, followed by the 100-day EMA at $77,681 and the 200-day EMA around $76,321. Together, these levels form a wider demand zone supporting the medium-term uptrend. A decisive daily close above the 50-day EMA at $80,797 would clear the way for further gains. If BTC cannot overcome that resistance, it could consolidate or retreat to test the nearby SuperTrend support again.
Altcoins technical analysis: Can Ethereum and XRP withstand mounting selling pressure?
A bearish broader outlook persists for Ethereum, which trades at $2,322, marginally above its 200-day EMA at $2,317. The 100-day EMA at $2,363 and the 50-day EMA at $2,459 remain above the price, restricting advances. Further reinforcing the downside bias is the SuperTrend line at $2,580, well above the spot price. An RSI around 34 and a falling MACD below zero point to sustained selling pressure, with conditions moving towards oversold levels rather than signalling a recovery.
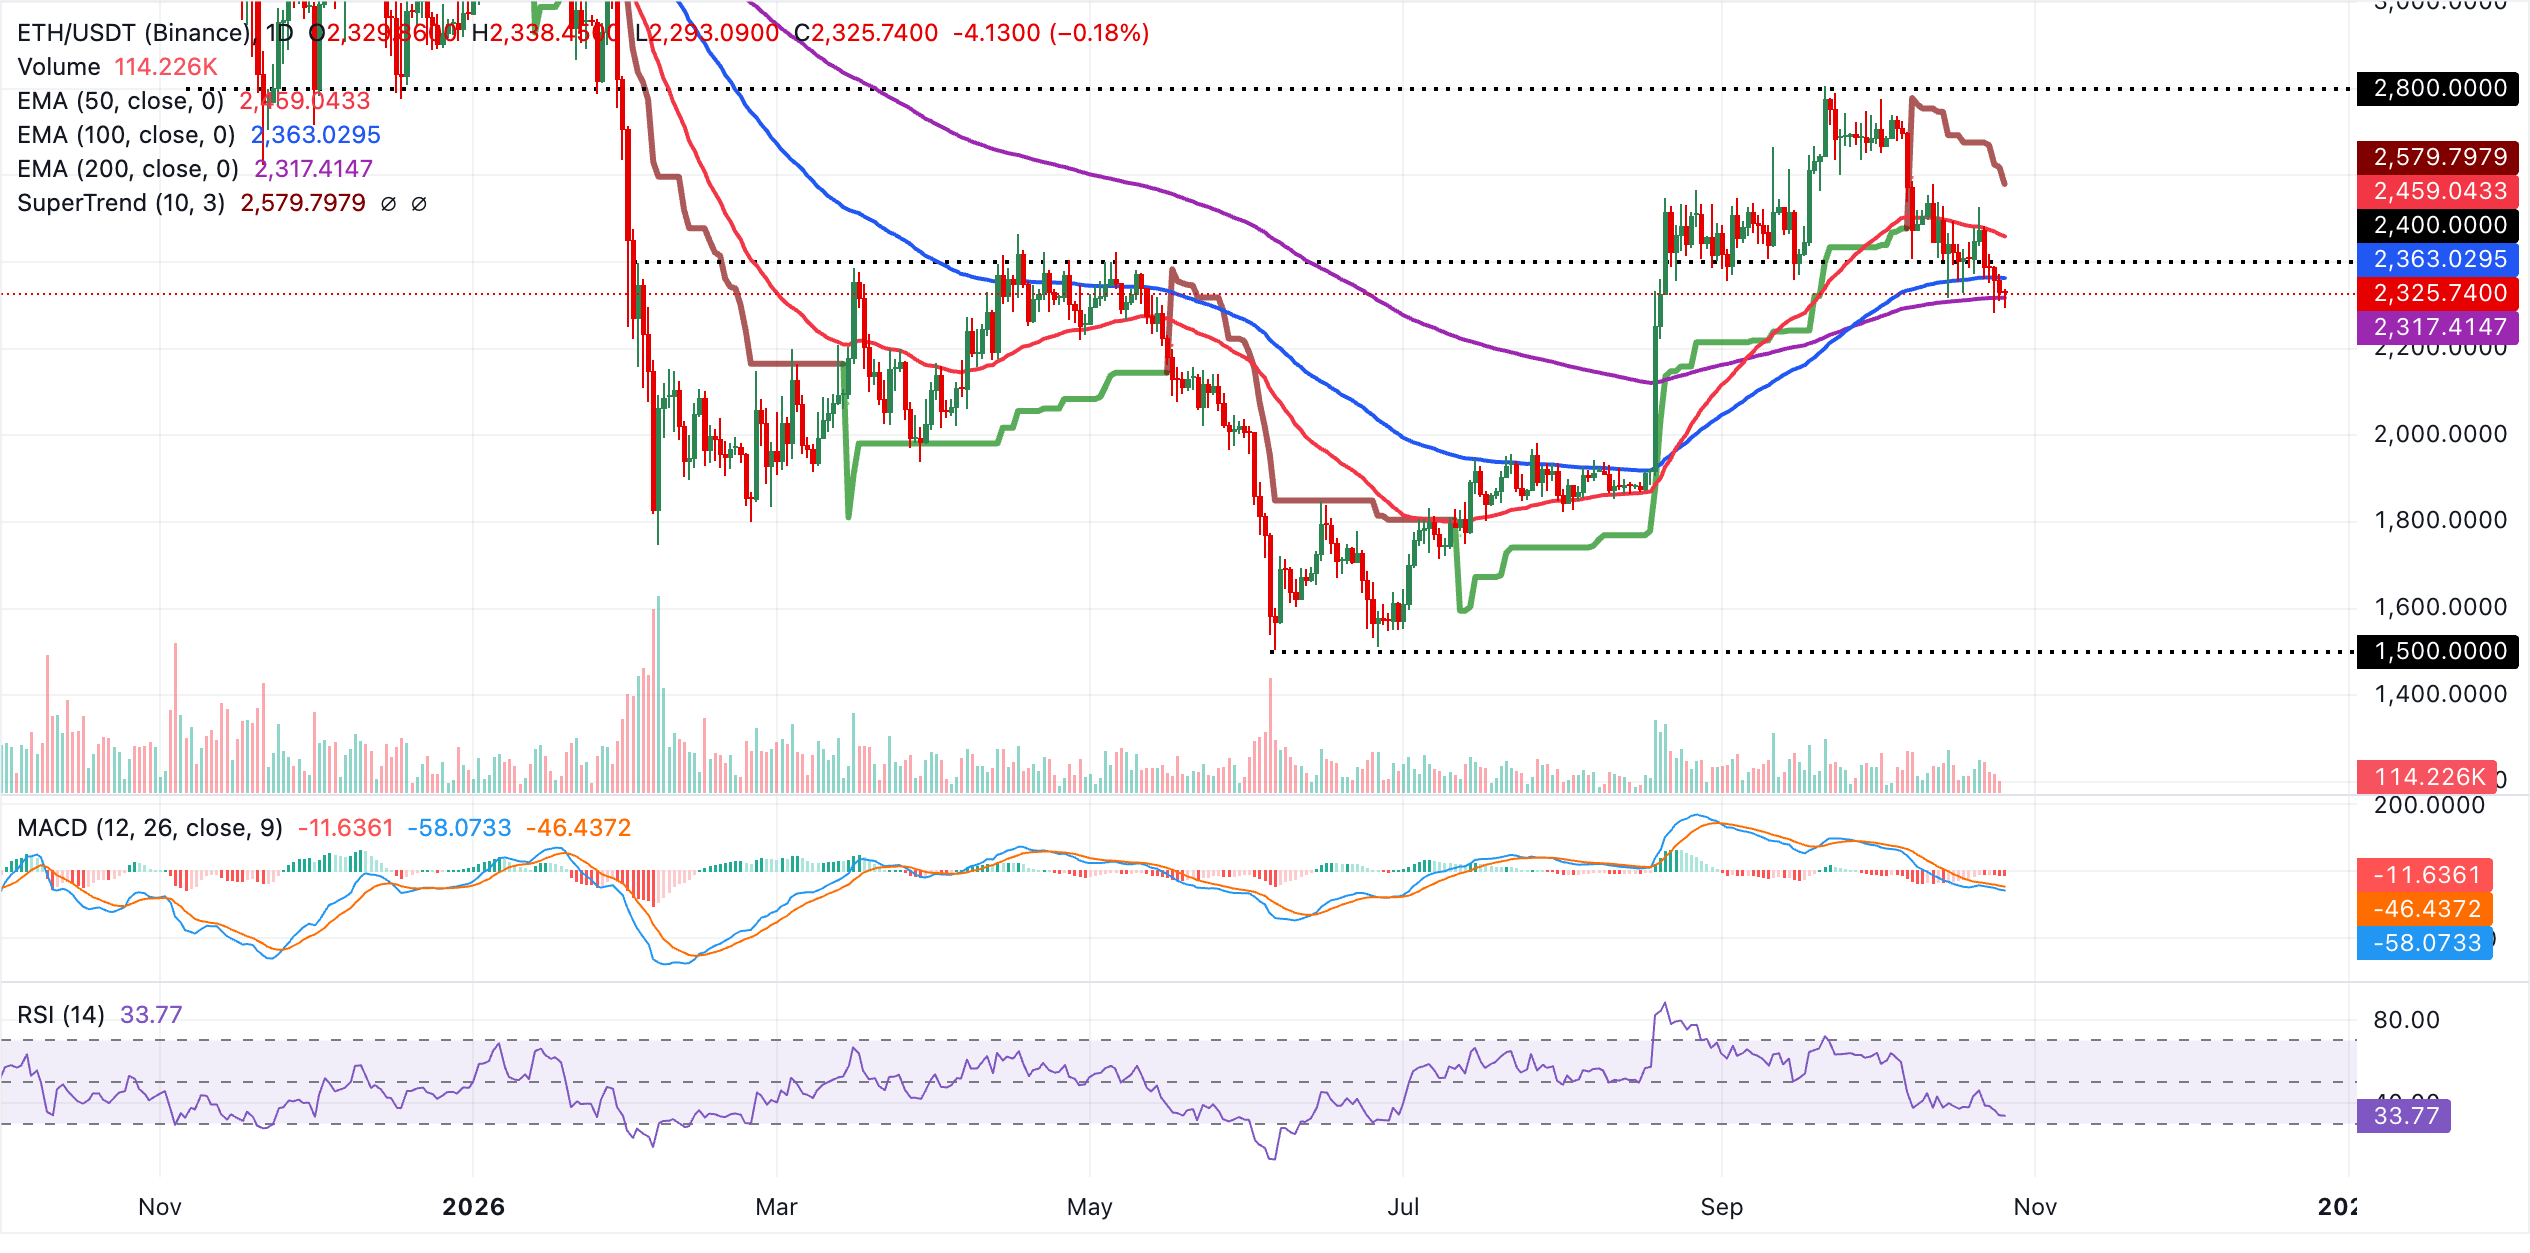
Any advance would first encounter resistance at the 100-day EMA near $2,363, followed by the 50-day EMA around $2,459. Beyond those levels, the SuperTrend line at $2,580 presents a stronger hurdle that must be overcome to indicate a more lasting bullish reversal. The 200-day EMA at $2,317 offers immediate support on the downside.
If the daily close falls below this support, a deeper correction would likely follow. Holding above it, by contrast, could give ETH room to consolidate before attempting another test of resistance in the mid-$2,300s.
At around $1.28, XRP continues to trade below its key moving averages, preserving a bearish near-term outlook. Above the price sit the 100-day EMA at $1.33, the 50-day EMA at $1.36 and the 200-day EMA at $1.37. This arrangement suggests that rallies are likely to face resistance while the wider downtrend persists.
The momentum readings add to this weakness: the MACD remains below zero despite a slight improvement, while the RSI is around 38, just above oversold territory. Together, they suggest continued downward pressure rather than a convincing rebound.
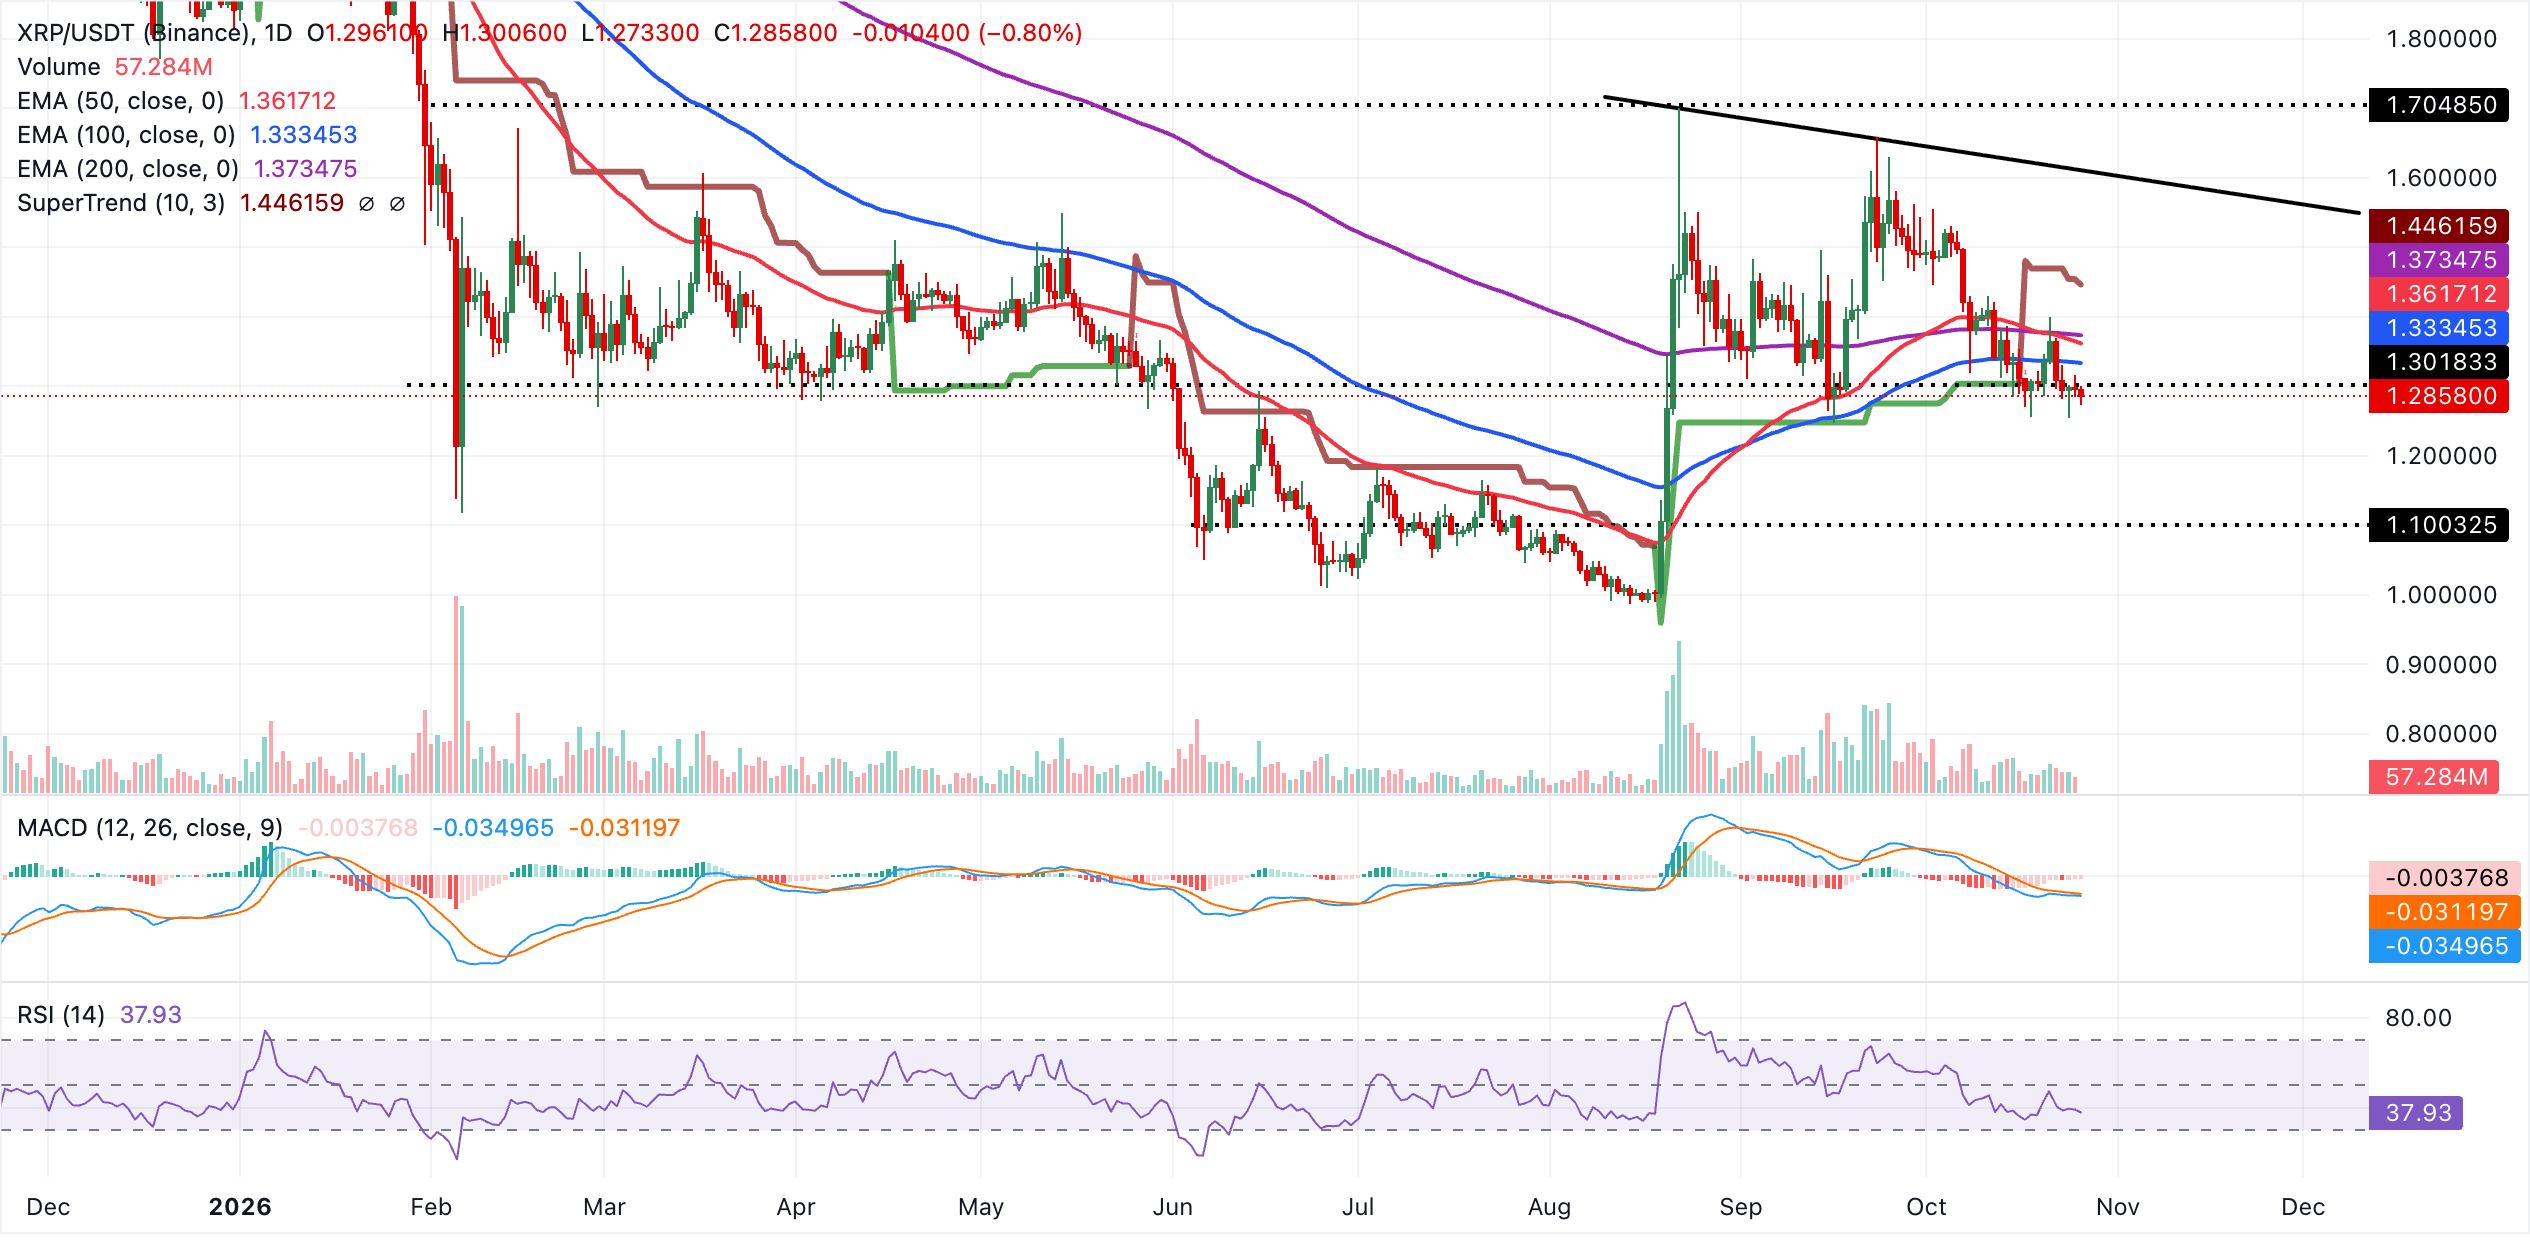
To ease the current bearish structure, XRP would need to regain a tightly grouped supply zone comprising the 100-day EMA near $1.33, the 50-day EMA around $1.36 and the 200-day EMA at $1.37. The 100-day EMA provides the first resistance. Further above, the latest SuperTrend line at $1.45 represents a more distant obstacle and aligns with the broader descending resistance trendline. That trendline continues to trace lower highs, reinforcing the prevailing negative bias for as long as the price stays below this cluster of resistance levels.
(The technical analysis of this story was written with the help of an AI tool. Know more.)
FAQs on Bitcoin, altcoins and stablecoins
Designed to function as money, Bitcoin is a virtual currency and the largest cryptocurrency by market capitalisation. No single person, group or entity can control this payment method, removing the need for third parties to participate in financial transactions.
Any cryptocurrency other than Bitcoin is considered an altcoin. Some, however, exclude Ethereum as well, since forks originate from these two cryptocurrencies. Under this interpretation, Litecoin is the first altcoin: it was forked from the Bitcoin protocol and is therefore an “improved” version of it.
A stablecoin is a cryptocurrency intended to maintain a stable price, backed by a reserve of the asset it represents. Its value is therefore pegged to a commodity or financial instrument, such as the US Dollar (USD), while an algorithm or demand regulates its supply. Primarily, stablecoins serve as an entry and exit route for investors looking to trade and invest in cryptocurrencies. They also enable investors to store value, given that cryptocurrencies are generally subject to volatility.
The ratio of Bitcoin's market capitalisation to the combined market capitalisation of all cryptocurrencies is known as Bitcoin dominance. This measure offers a clear indication of investor interest in Bitcoin. BTC dominance is typically high before and during a bull run, when investors turn to relatively stable cryptocurrencies with large market capitalisations, such as Bitcoin. Conversely, falling BTC dominance usually indicates that investors are shifting capital and/or profits into altcoins in pursuit of higher returns, often setting off a surge in altcoin rallies.
POPULAR ARTICLES
1Australian Dollar: Will inflation data reinforce its yield advantage? – BBH2British Pound outpaces Japanese Yen as UK Budget and BoJ decision approach3Brazilian Real: Why is the election shock deepening losses against the US Dollar? - SocGen4USD/CAD Price Forecast: Oil Prices Weigh on the CAD as Dollar Strengthens Above 1.40005US Dollar: Why do political risks remain high? – Commerzbank6Japanese Yen: UOB expects more upside against US Dollar7Euro: Gains against US Dollar face a ceiling near 1.1270 – ING8Why is the Japanese Yen lagging as the US Dollar rebounds and Fed-BoJ comes into focus?9Brazilian Real: How Is the Election Shock Driving a Sharp Repricing? – Deutsche Bank
LIVE QUOTES


ALL ABOUT TECHNICAL
What Is a Breaker Block in Trading, and How Can You Trade It?
Elliott Wave Theory: How Do Traders Apply Its Patterns and Rules?
What Does Smart Money Concept (SMC) Mean, and How Can You Trade It?
What Is an Order Block in Trading and How Can You Trade It?
Average True Range (ATR) Indicator: What Is the Formula, and How Do You Read and Use It?
What Is a Judas Swing? ICT Trading Strategy Explained With Examples
The Real Interest Rate: Are Your Savings Actually Earning Anything?
Butterfly Pattern Trading: How to Identify and Trade the Butterfly Harmonic Pattern
What Is a Rising Wedge Pattern and How Do You Trade It?
Get Started!
Sign up and access the Global Markets in less than 3 minutes

Connect With Us












The information provided on this website is of a general nature only and does not constitute personal financial advice. Before acting on any information on this website, you should consider the suitability of the information in relation to your objectives, financial situation and needs. Investing in CFDs and FX Margin Contracts carries significant risks and is not suitable for all investors. You may lose more than your initial deposit. You do not own, or have, any interest in the underlying asset. We recommend that you seek independent advice and ensure you fully understand the risks involved before trading. It is important that you read and consider the disclosure document before you acquire any product listed on the website. The information and advertisements offered on this website are not intended for use by any person in any country or jurisdiction where such use would be contrary to local laws and regulations. The Products and Services offered on this website are not intended for residents of the United States, Malaysia and Thailand.
TMGM is authorized and regulated in various jurisdictions.
Trademax Australia Limited, trading as TMGM, is regulated by the Australian Securities and Investments Commission (ASIC), AFSL no. 436416 and is located at Level 28, One International Tower, 100 Barangaroo Avenue, 2000 Sydney, NSW Australia.
Email: [email protected]
Trademax Global Limited, trading as TMGM, is authorized and regulated by the Vanuatu Financial Services Commission (VFSC), registration number 40356 and registered at 1276, Kumul Highway, Port Vila, Vanuatu, Republic of Vanuatu.
Email: [email protected]
Trademax Global Markets (SE) Limited, trading as TMGM, is authorized and regulated by the Financial Services Authority (FSA) of Seychelles, with license number SD224. The company is registered at Office No 13, Providence Estate ABIS Centre, Mahe, Seychelles.
Email: [email protected]
Trademax Global Markets (International) Pty Ltd, trading as TMGM, is authorized and regulated by the Financial Services Commission, Mauritius (FSC) with license no. GB22201012, and registered at 33, Edith Cavell Street C/o IQ EQ Fund Services (Mauritius) Ltd Port Louis, 11324 Mauritius.
Email: [email protected]
Copyright © TMGM. All rights reserved