

Trading
Explore a wide range of markets with competitive pricing, deep liquidity, and advanced trading tools.
Learn More 
Platform
Trade seamlessly with TMGM's powerful platform, built for speed, precision, and a superior trading experience.
Learn More Trading Platform
Academy
Learn the fundamentals of trading with beginner-friendly resources, including guides, webinars, and market insights.
Learn More News & Analysis
Get real-time market updates and expert analysis to stay ahead of trading opportunities
Learn More News & Analysis
About
Learn what sets TMGM apart — our global presence, regulatory strength, and commitment to innovation in trading.
Learn More Why Choose TMGM
Sponsorship
Crypto Today: Can Bitcoin, Ethereum and XRP withstand mounting sell-side pressure?
- Bitcoin loses $80,000 support, with market participants awaiting the Fed’s interest rate decision.
- Weakening market sentiment pushes Ethereum lower to test the demand zone at $2,300.
- XRP buyers battle to hold support at $1.30, although declining moving averages and fading momentum could keep any recovery in check.
Selling pressure is weighing on the broader cryptocurrency market on Tuesday, with Bitcoin (BTC) leading the correction as it slips further below the crucial $80,000 mark. A similar neutral-to-bearish outlook prevails for Ethereum (ETH), while Ripple (XRP) trades close to $1.30.

Can the Fed decision shift weakening market sentiment?
Sentiment towards cryptocurrencies has weakened in recent weeks as macroeconomic uncertainty, geopolitical tensions and a shortage of key catalysts undermine the market’s ability to sustain gains and consolidate at higher levels. Attention now centres on Wednesday’s interest rate decision from the Federal Reserve (Fed).
The probability of the Federal Open Market Committee (FOMC) leaving rates in the 3.75-4.00% range stands at nearly 90%, according to CME’s FedWatch Tool. Only 10% of market participants anticipate an increase.
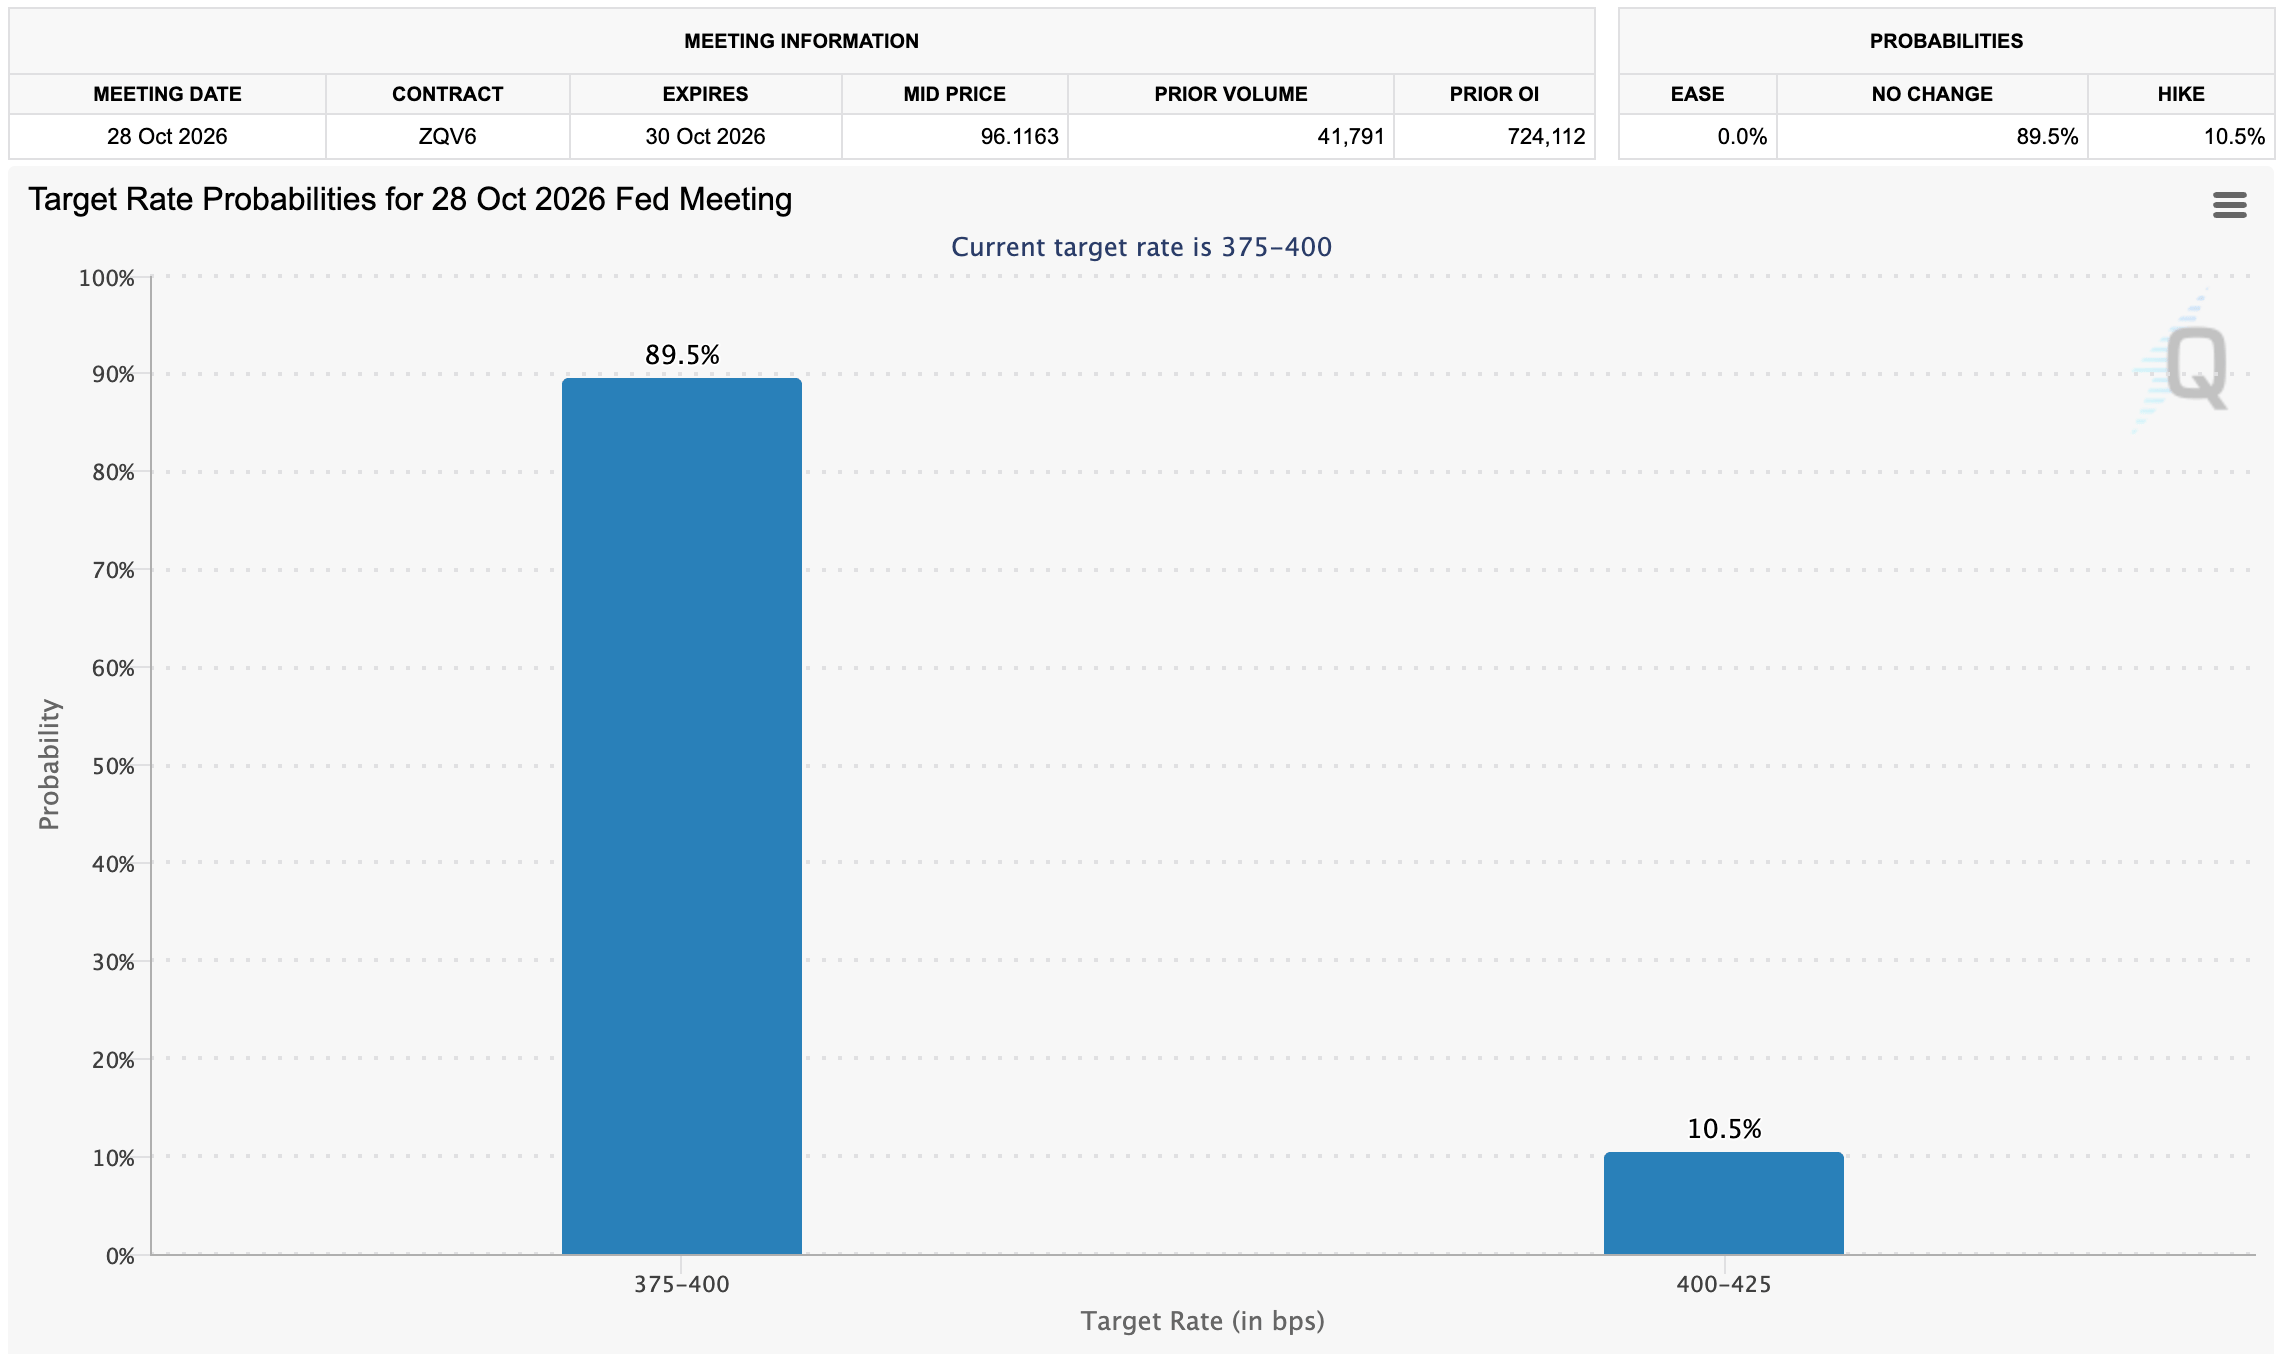
With possible spikes in volatility ahead of the Fed announcement, traders could continue adjusting their positions. As rates are expected to stay unchanged, Fed Chair Kevin Warsh’s post-meeting press conference will be closely watched for signals on the central bank’s monetary policy direction.
In an analysis report sent by email, Crypto Finance said, “We expect rates to remain unchanged, so the focus will be on the dot plot and any shift in the forward path,” and added, “Markets currently price a ~90% probability of a skip, followed by a December hike and two further hikes by year-end 2027, taking the target range to 4.50–4.75%.”
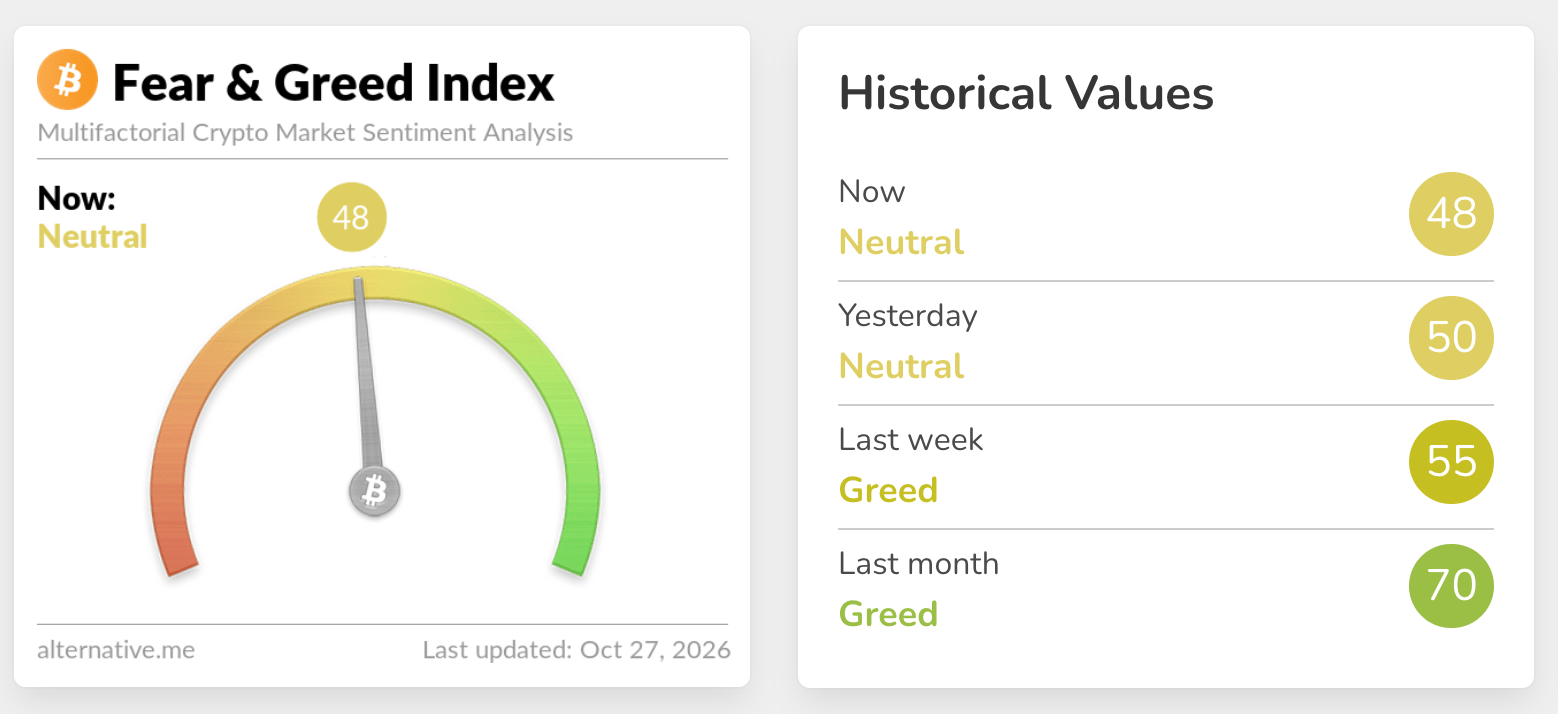
Demand for digital assets is still receding, with the Fear & Greed Index now at 48, in Neutral territory. This compares with 55 in the Greed range last week and 70 in the Greed zone last month. A continuation of this trend could make it harder for major crypto assets to maintain elevated prices, leaving Bitcoin likely to revisit structural and psychological levels towards $75,000.
Bitcoin technical analysis: Can BTC bears take control of the trend?
A near-term bearish bias persists for Bitcoin at $79,795, with the 50-day Exponential Moving Average (EMA) at $80,761 limiting the upside. Nevertheless, trading above the 100-day and 200-day EMAs, at $77,725 and $76,375 respectively, points to an underlying constructive broader trend as the latest price leg consolidates.
Immediate demand lies just below the spot price at the $79,664 SuperTrend line. Meanwhile, a Relative Strength Index (RSI) reading of 40 and a negative Moving Average Convergence Divergence (MACD) histogram signal that momentum has weakened following the recent highs.
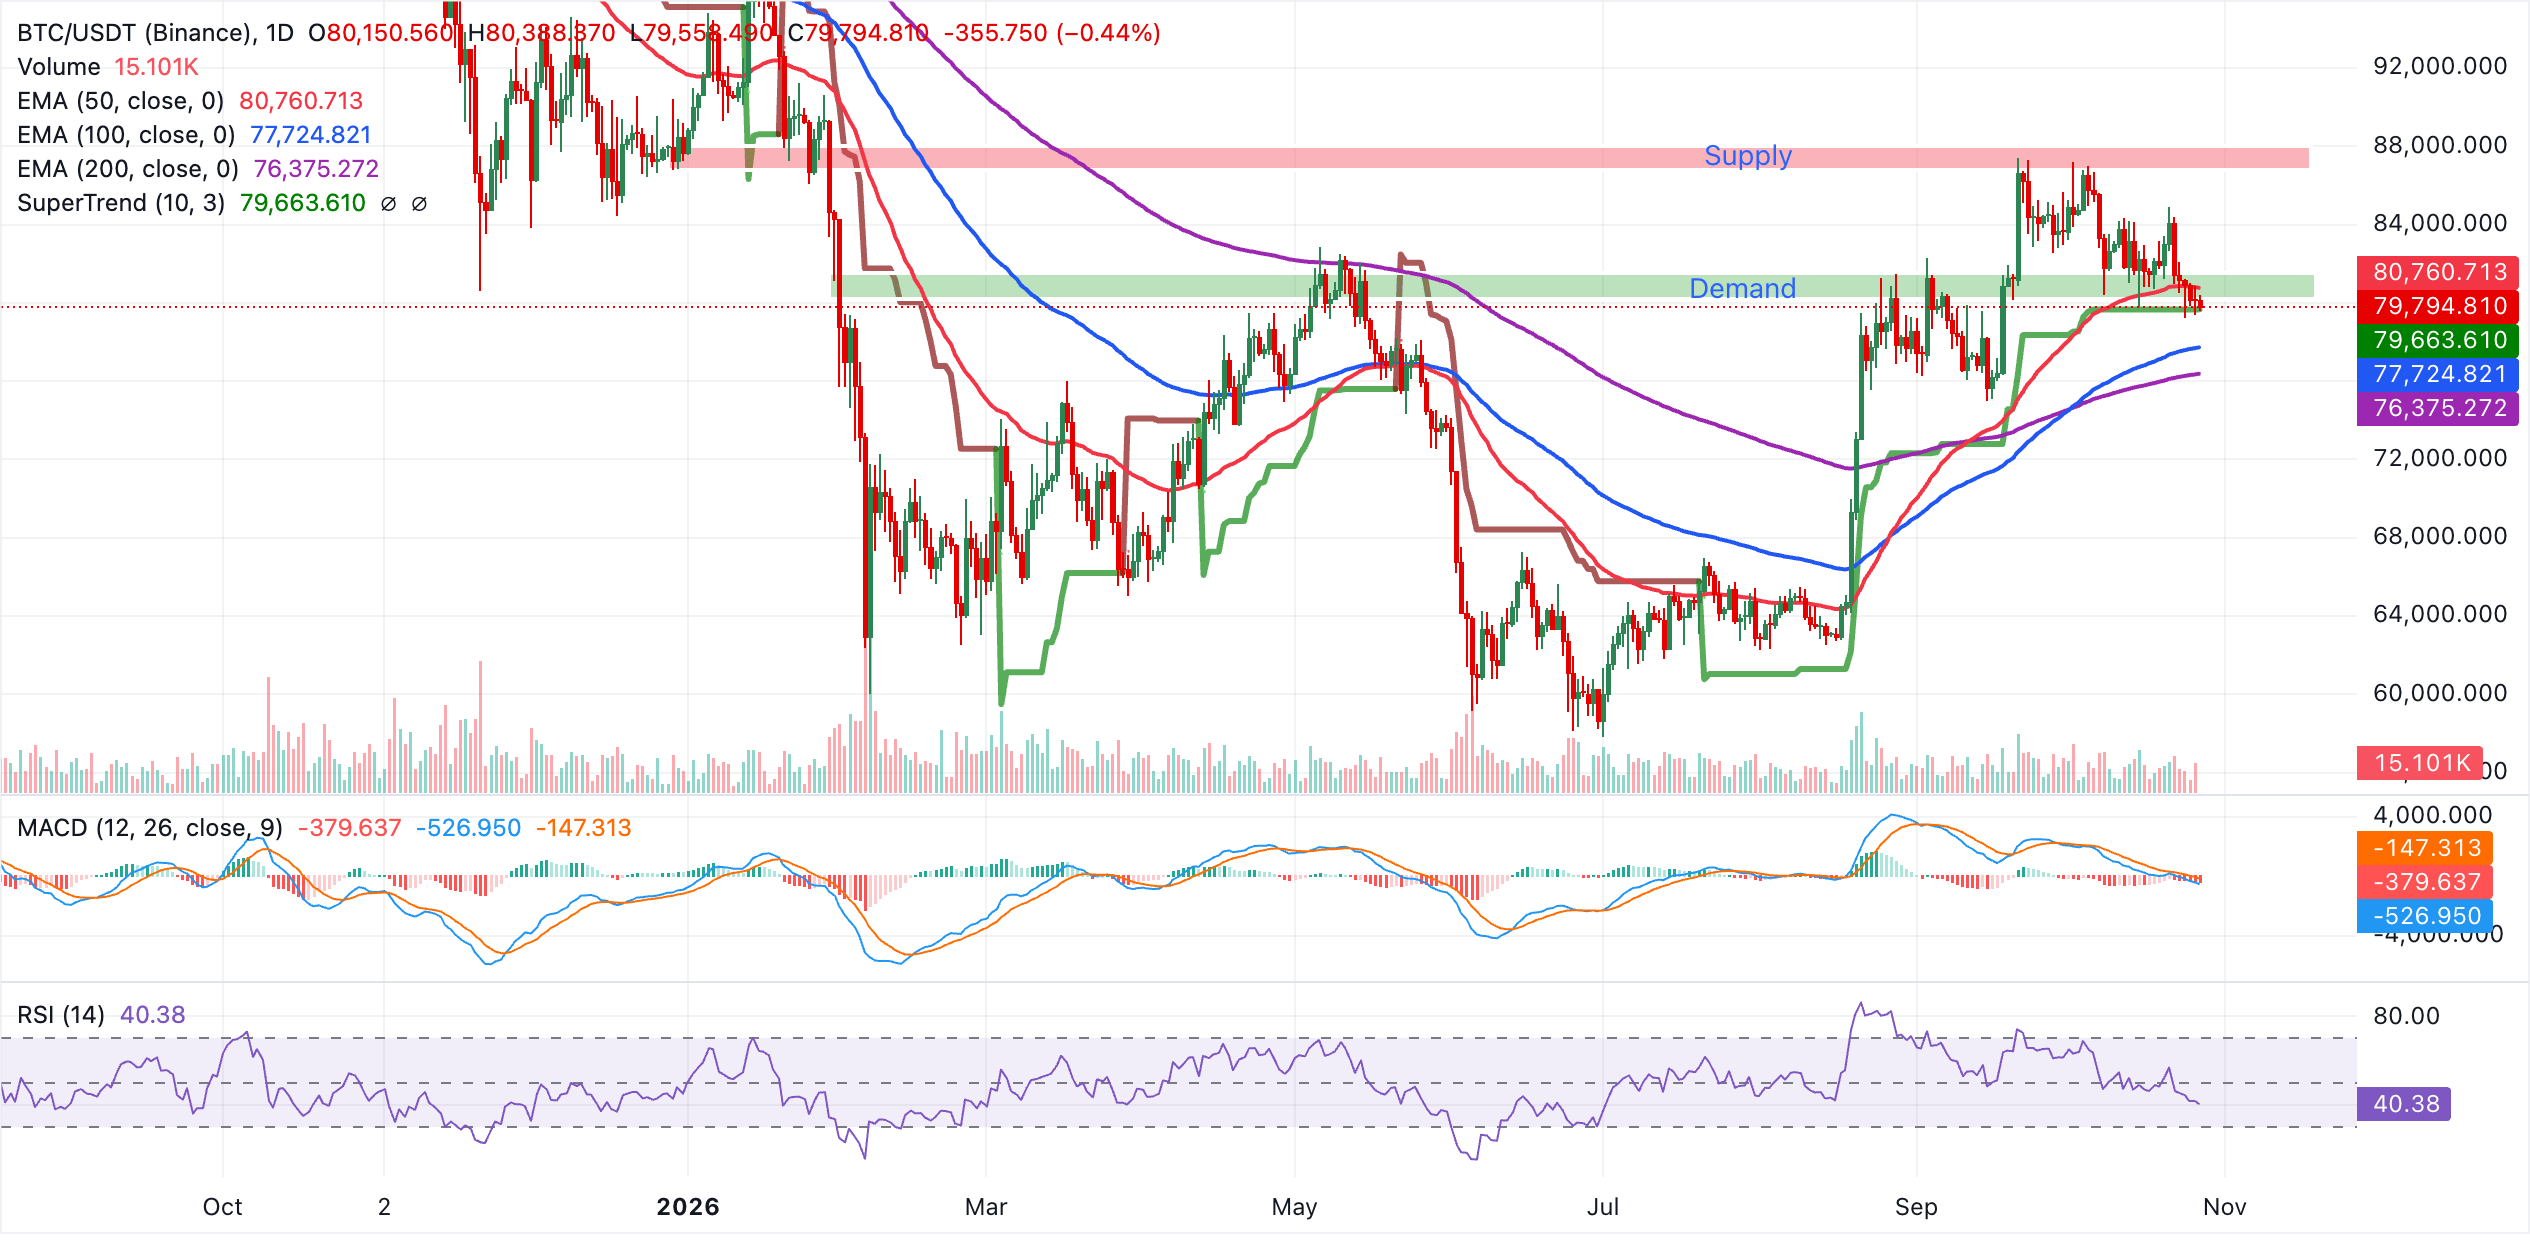
The first upside barrier is the 50-day EMA at $80,7602. Only a daily close above it would soften the prevailing bearish bias and clear the way for a return towards the recent peak zone.
For the immediate downside, the current trading area near $79,795 provides a very short-term floor, backed by nearby SuperTrend support at $79,664. Losing this support cluster would bring the 100-day EMA at $77,725 into focus, followed by the 200-day EMA at $76,375. Buyers would be expected to step in at these deeper support levels to re-establish the broader uptrend.
Ethereum technical analysis: Could ETH face a sharper sell-off?
Below all major moving averages and the SuperTrend baseline, Ethereum retains a bearish short-term outlook while trading at $2,312. The price sits just beneath the 200-day EMA at $2,316. Further overhead, the 100-day EMA at $2,362 and the earlier break level of the rising trendline near $2,362 strengthen the supply zone.
Even as the pair steadies above its recent lows, momentum remains fragile. The RSI is close to the lower 30s and the MACD line stays negative, indicating continued downward pressure.
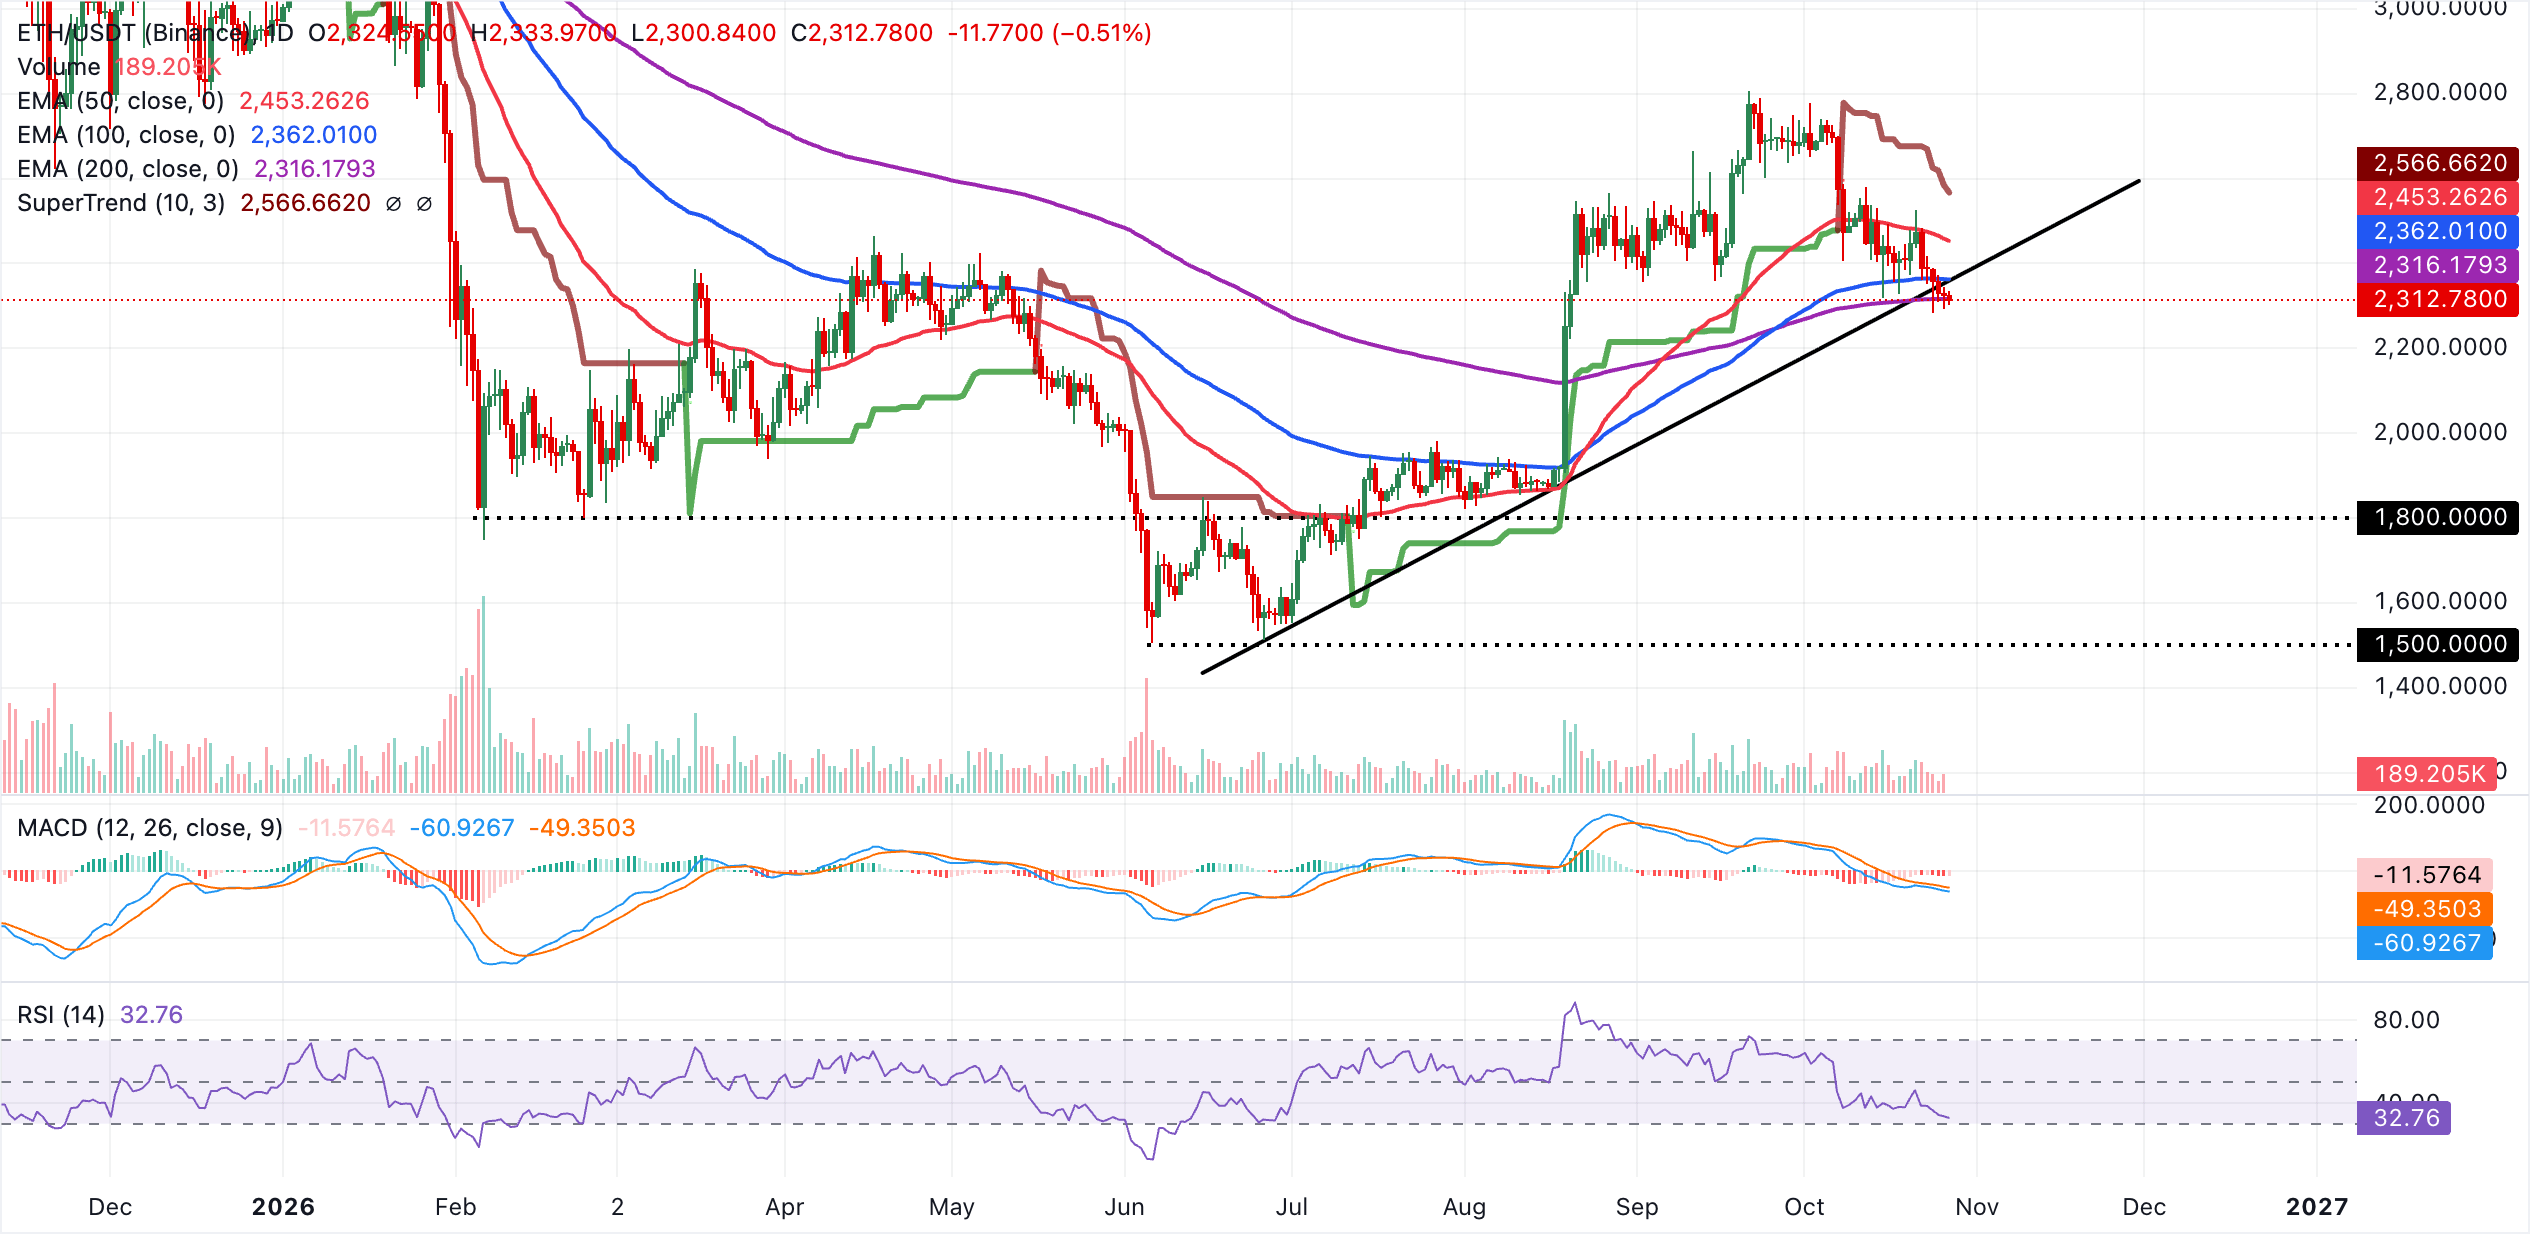
The 200-day EMA near $2,316 presents the first resistance. Beyond that, a more substantial barrier around $2,362, where the 100-day EMA meets the broken ascending trendline, could restrict recovery attempts.
The next hurdles are the 50-day EMA at $2,453 and the SuperTrend line at $2,566; both would have to be reclaimed to reduce the broader bearish pressure. The daily chart offers no clearly identified support beneath the current price. Consequently, a sustained move below $2,312 would leave ETH exposed to lower levels of fresh demand not shown here.
Ripple technical analysis: Can XRP withstand mounting headwinds?
Trading at $1.30, XRP remains under pressure in the near term, below every major moving average and the active SuperTrend line. Overhead barriers include the 100-day EMA at $1.33, the 50-day EMA at $1.36 and the 200-day EMA at $1.37. A broader descending resistance trendline also continues to restrict gains.
The RSI near 40 and a still-negative MACD point to weak momentum without oversold conditions. Together, they suggest ongoing downside pressure rather than a bullish reversal in the immediate future.
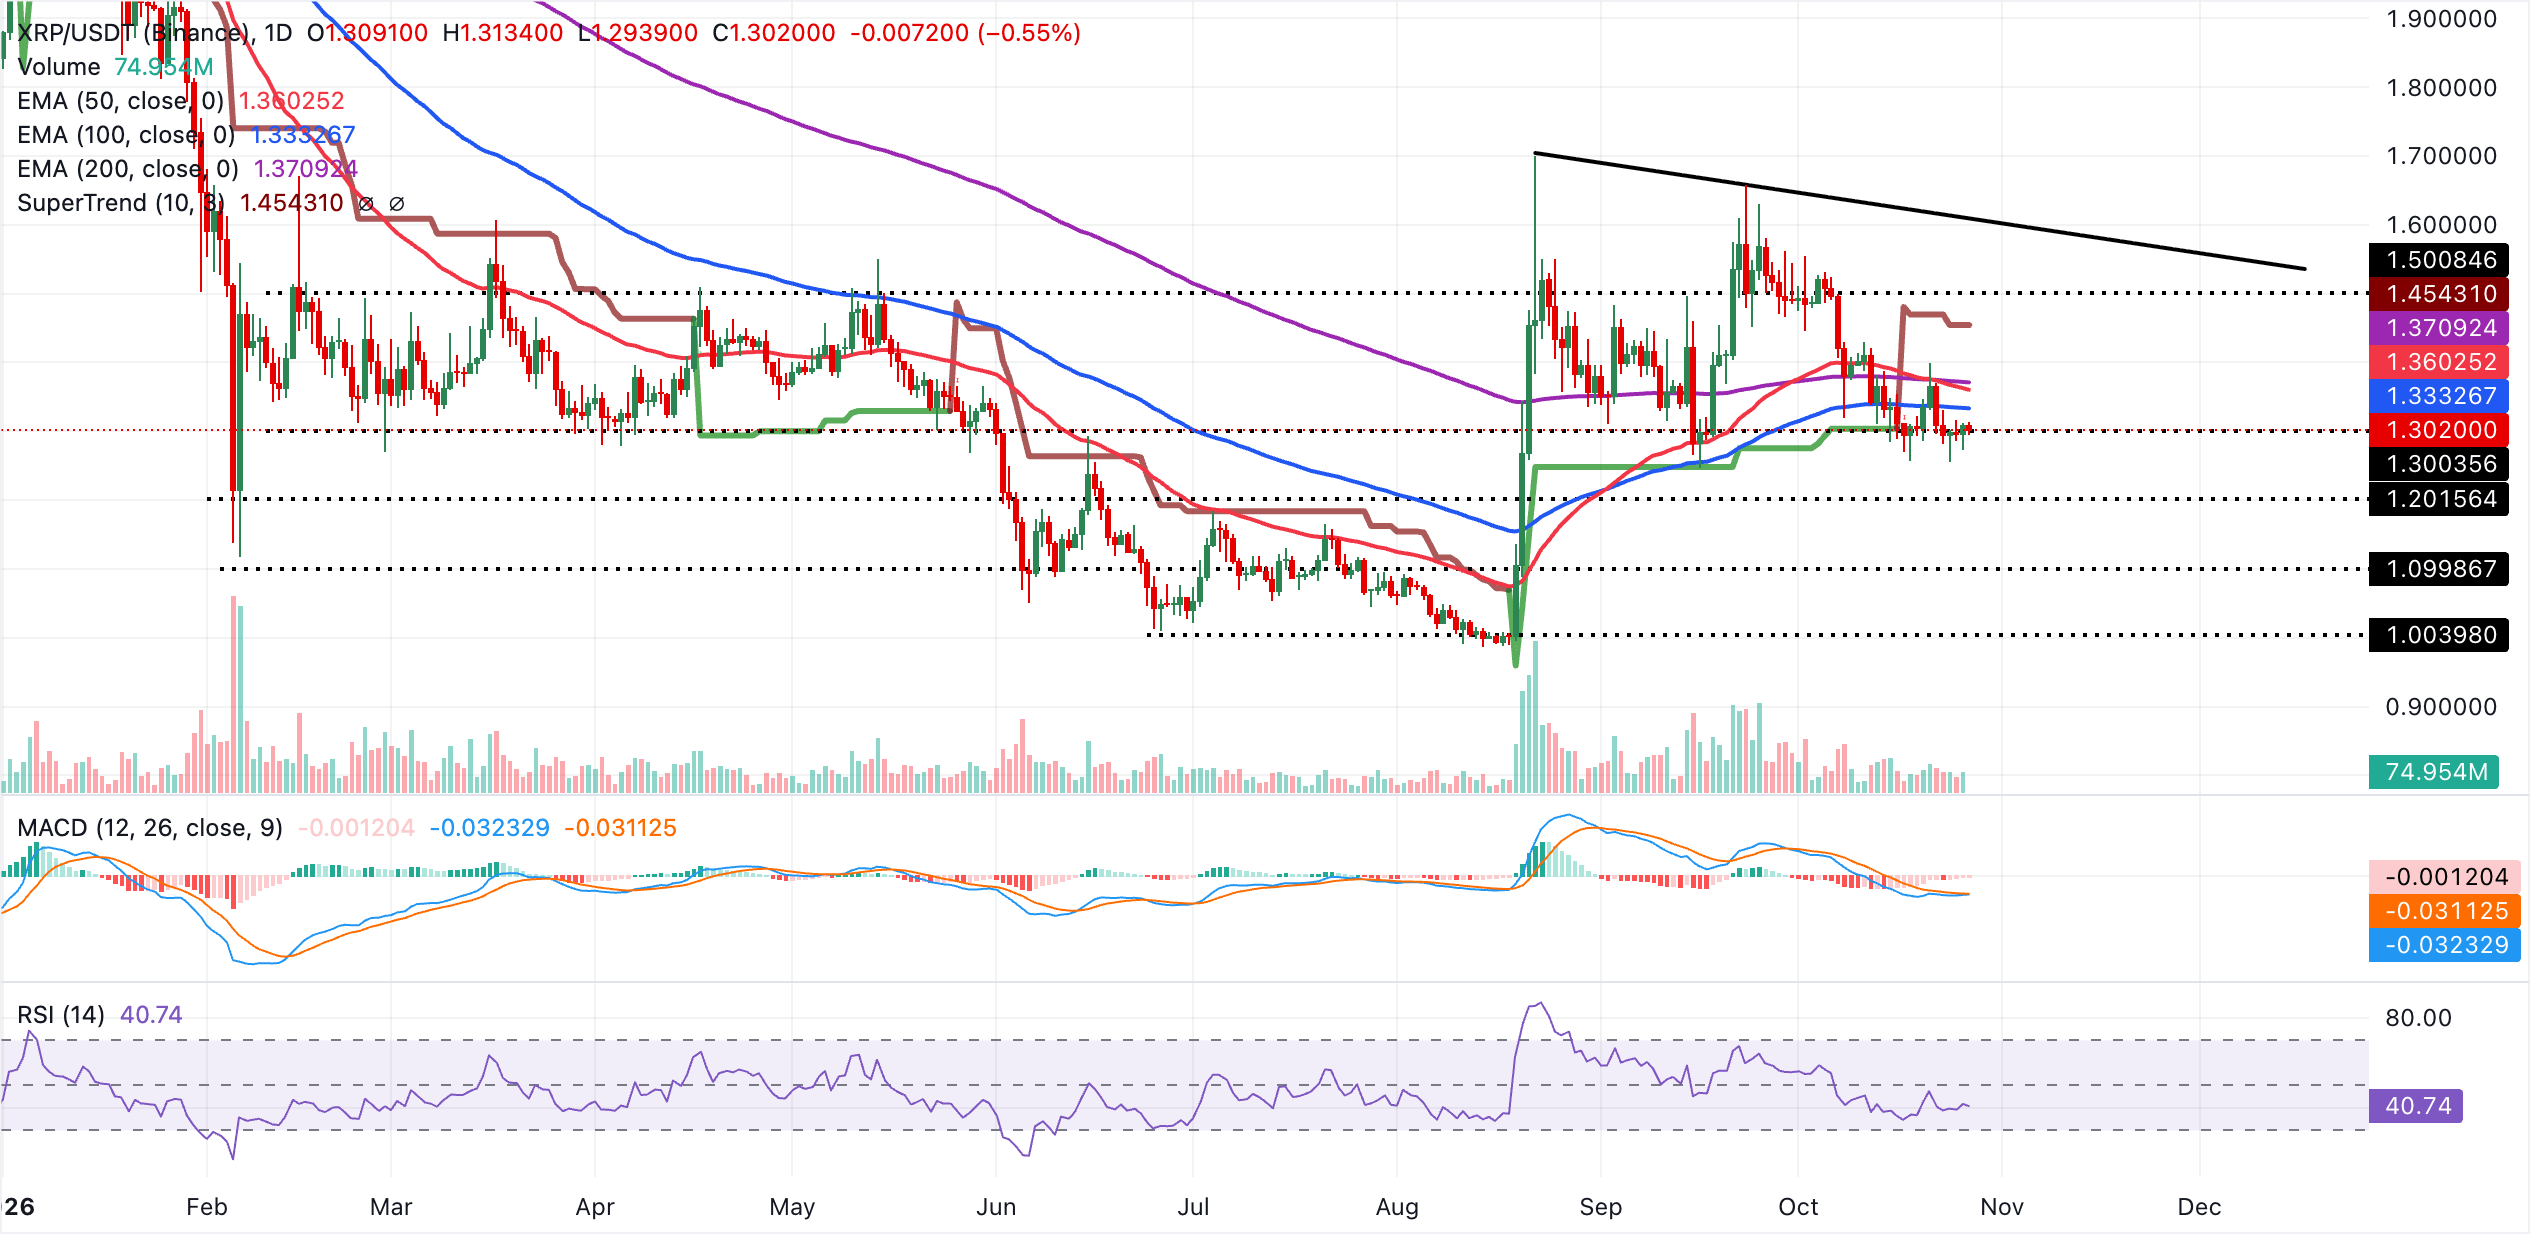
The first hurdle is the 100-day EMA around $1.33, with the 50-day EMA near $1.36 and the 200-day EMA at $1.37 following above it. These averages form a concentrated supply zone alongside the descending trendline resistance. Further away, the SuperTrend level at $1.45 represents a structural barrier that must be regained to temper the broader bearish outlook. With no clearly established nearby support below $1.30, renewed selling could rapidly drive prices lower until the chart develops a fresh demand zone.
(The technical analysis of this story was written with the help of an AI tool. Know more.)
FAQs on Bitcoin, altcoins and stablecoins
Designed as a virtual form of money, Bitcoin ranks as the largest cryptocurrency by market capitalisation. No single individual, group or entity can control this payment method, removing the requirement for third-party involvement in financial transactions.
Any cryptocurrency other than Bitcoin is classified as an altcoin. Some, however, exclude Ethereum as well, since forks originate from these two cryptocurrencies. Under this interpretation, Litecoin is the first altcoin: it was forked from the Bitcoin protocol and is therefore an “improved” version of it.
To maintain a stable price, stablecoins are structured as cryptocurrencies backed by reserves of the assets they represent. Each stablecoin’s value is therefore linked to a commodity or financial instrument, such as the US Dollar (USD), while an algorithm or demand governs its supply. Their primary purpose is to offer an entry and exit route for investors seeking to trade and invest in cryptocurrencies. They also enable investors to preserve value, given the volatility that generally characterises cryptocurrencies.
By comparing Bitcoin’s market capitalisation with the combined market capitalisation of all cryptocurrencies, Bitcoin dominance offers a clear measure of investor interest in Bitcoin. BTC dominance is typically high ahead of and during a bull run, when investors favour relatively stable cryptocurrencies with large market capitalisations, such as Bitcoin. Falling BTC dominance generally signals that investors are shifting capital and/or profits into altcoins in pursuit of better returns, often setting off a surge in altcoin rallies.
POPULAR ARTICLES
1Crypto Today: Can Bitcoin, Ethereum and XRP withstand mounting sell-side pressure?2Euro’s losing streak against US Dollar continues: What next for Fed-ECB policy?3US Dollar: How are AI equity risks putting pressure on the Greenback? – TD Securities4Japanese Yen: Could BoJ caution deepen losses against US Dollar? – MUFG5Top Altcoins Price Forecast: Why are Ripple, Cardano and Solana extending losses as selling pressure persists?6Bitcoin Price Forecast: Why is BTC holding below $80,000 with Middle East tensions and tech earnings in focus?7Australian Dollar: Is momentum fading near recent highs against US Dollar? – UOB8Silver price today: FXStreet data shows a decline in silver9Gold: What are the two-way risks near recent lows? – OCBC
LIVE QUOTES

ALL ABOUT TECHNICAL
What Do Reversal Patterns Tell You, and How Can You Trade Them?
How Does a Continuation Pattern Work? Definition, Types and Strategies for Trading
What Is a Breaker Block in Trading, and How Can You Trade It?
Elliott Wave Theory: How Do Traders Apply Its Patterns and Rules?
What Does Smart Money Concept (SMC) Mean, and How Can You Trade It?
What Is an Order Block in Trading and How Can You Trade It?
Average True Range (ATR) Indicator: What Is the Formula, and How Do You Read and Use It?
What Is a Judas Swing? ICT Trading Strategy Explained With Examples
The Real Interest Rate: Are Your Savings Actually Earning Anything?
Get Started!
Sign up and access the Global Markets in less than 3 minutes

Connect With Us












The information provided on this website is of a general nature only and does not constitute personal financial advice. Before acting on any information on this website, you should consider the suitability of the information in relation to your objectives, financial situation and needs. Investing in CFDs and FX Margin Contracts carries significant risks and is not suitable for all investors. You may lose more than your initial deposit. You do not own, or have, any interest in the underlying asset. We recommend that you seek independent advice and ensure you fully understand the risks involved before trading. It is important that you read and consider the disclosure document before you acquire any product listed on the website. The information and advertisements offered on this website are not intended for use by any person in any country or jurisdiction where such use would be contrary to local laws and regulations. The Products and Services offered on this website are not intended for residents of the United States, Malaysia and Thailand.
TMGM is authorized and regulated in various jurisdictions.
Trademax Australia Limited, trading as TMGM, is regulated by the Australian Securities and Investments Commission (ASIC), AFSL no. 436416 and is located at Level 28, One International Tower, 100 Barangaroo Avenue, 2000 Sydney, NSW Australia.
Email: [email protected]
Trademax Global Limited, trading as TMGM, is authorized and regulated by the Vanuatu Financial Services Commission (VFSC), registration number 40356 and registered at 1276, Kumul Highway, Port Vila, Vanuatu, Republic of Vanuatu.
Email: [email protected]
Trademax Global Markets (SE) Limited, trading as TMGM, is authorized and regulated by the Financial Services Authority (FSA) of Seychelles, with license number SD224. The company is registered at Office No 13, Providence Estate ABIS Centre, Mahe, Seychelles.
Email: [email protected]
Trademax Global Markets (International) Pty Ltd, trading as TMGM, is authorized and regulated by the Financial Services Commission, Mauritius (FSC) with license no. GB22201012, and registered at 33, Edith Cavell Street C/o IQ EQ Fund Services (Mauritius) Ltd Port Louis, 11324 Mauritius.
Email: [email protected]
Copyright © TMGM. All rights reserved