

Dow Jones Industrial Average falls on a jobs number the president loves
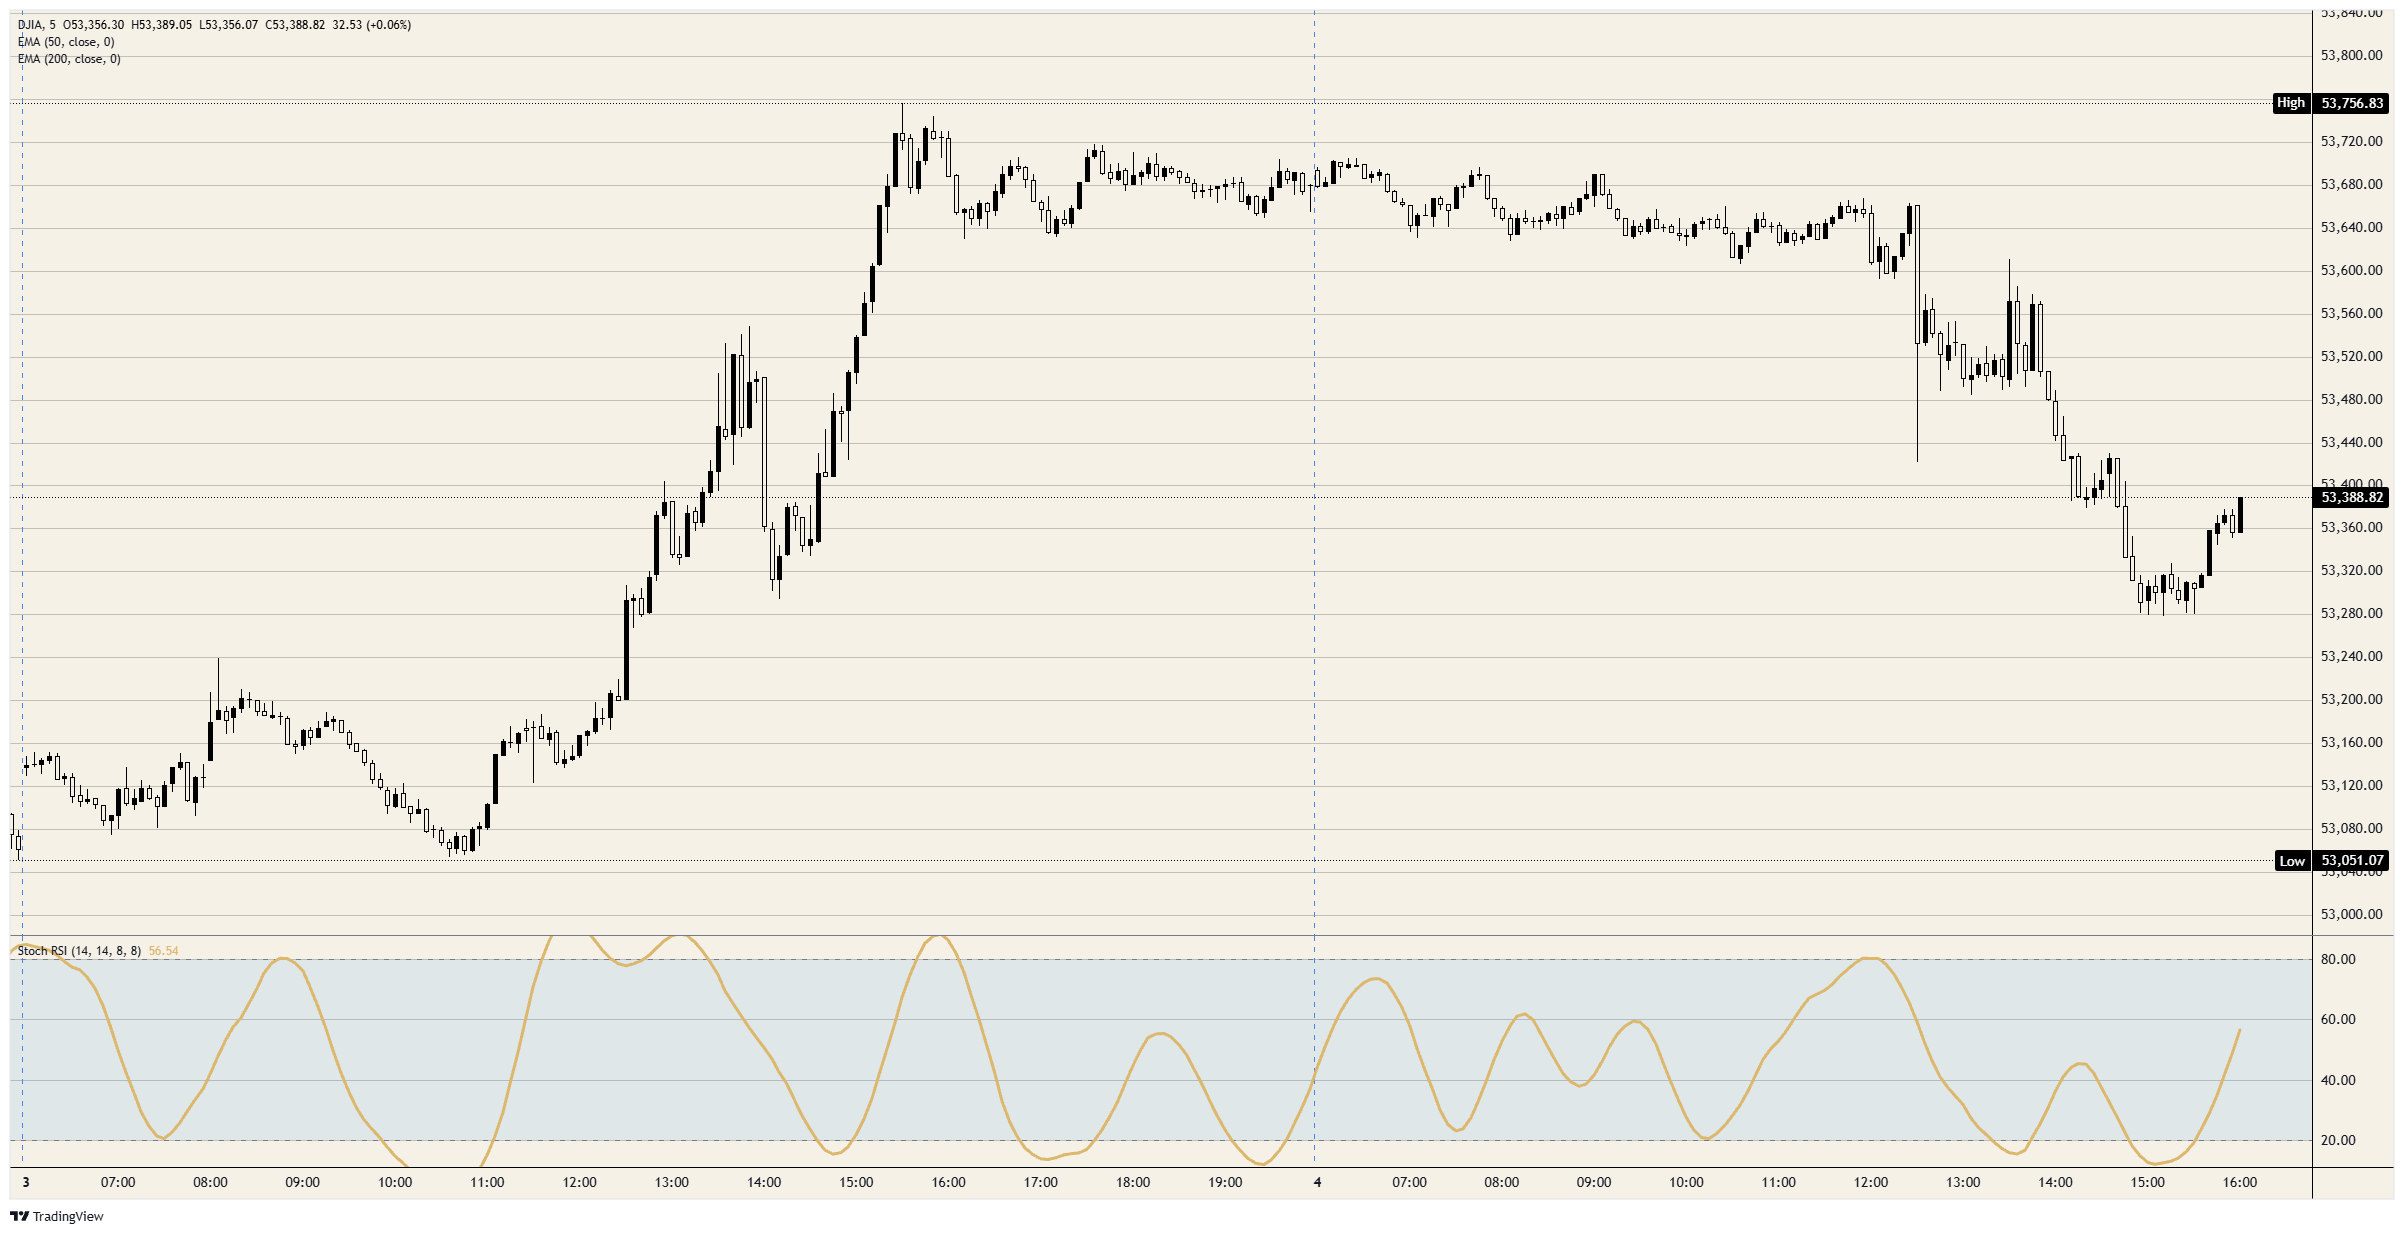
- DJIA short of 53,400, down roughly 325 points, low just under 53,300 at 15:00 GMT.
- Payrolls 162K against a 56K forecast, U6 underemployment at 7.7%, lowest since June 2025.
- Hike odds above 60% from roughly even on Thursday as the president demands a cut.
The Dow Jones Industrial Average trades just short of 53,400, roughly 325 points or 0.6% lower on Friday, after August Nonfarm Payrolls (NFP) printed 162K against a 56K forecast at 12:30 GMT and pushed the probability of a September hike above 60%. Thursday's 600-point rally was built on a governor's lean toward a hold that he made conditional on the data, and the data spent that condition inside one five-minute bar.

A labour market that took away the excuse
The 162K headline is the strongest monthly gain since March and more than five times the 31K average of the previous twelve months, with July revised to a 21K gain from a 23K loss and June marked up as well. The unemployment rate held at 4.1% as forecast while participation rose to 61.6% from 61.4%, the U6 underemployment rate fell to 7.7% from 7.9%, its lowest since June 2025, and average hourly earnings rose 0.3% MoM as forecast with the annual rate at 3.1% against 3% expected.
A Chair who used Jackson Hole to say the Fed has work to do if inflation persists was never going to rest a hold on weak hiring, so the only defensible case for one was a labour market too soft to tighten into, and it lasted one release. The two-year Treasury yield rose roughly eight basis points to above 4.40%, its highest since January 2025, and the index is trading that move rather than the payroll count.
Sixty for September, one hundred by December
Fed funds futures now price a 60.4% probability of a quarter-point hike at the September 16 decision against 39.6% for a hold, from close to even on Thursday. The rest of the table matters more: October carries an 87% probability of at least one hike, December leaves nothing on the current 3.50% to 3.75% range and puts 40% on two, and by March 2027 the entire distribution sits at 4.00% to 4.25%.
The curve is not debating whether the Fed tightens, only whether the first move lands on September 16 or six weeks later, and Friday's print moved the date rather than the destination. A 0.6% decline is the price of a date, which is why the index sits roughly 2.5% beneath the early-August record rather than further.
The president's leverage is the index's supply chain
At 13:56 GMT the president praised the number, told the Fed board to be patriots, and wrote that unless the rate is lowered he will stop trading with every country the United States runs a deficit with, more than 90 of them. He cited the February Supreme Court ruling that struck down his tariffs under the International Emergency Economic Powers Act (IEEPA), and the ruling does leave him the lever, since the statute's explicit power to prohibit importation was not what the court took away.
For a price-weighted index of 30 multinationals the threat lands on the constituents, not the Fed. Apple (AAPL) assembles in China, India and Vietnam, Nike (NKE) makes most of its footwear in Vietnam and Indonesia, Walmart (WMT) is the largest containerized importer in the country, and Boeing (BA) and Caterpillar (CAT) sell into the markets an embargo would seal. The deficit in question ran to roughly $1.2 trillion last year, with China above $200 billion of it.
The second leg of the decline began within minutes of the post, running from the 53,500 area to the session low just under 53,300 by 15:00 GMT. A two-year yield climbing all morning could have produced that leg alone, but an index whose products are built in the countries named cannot file the threat under noise. The mechanics also run against the demand: an embargo is a supply shock, a supply shock lifts prices, and higher prices argue for a higher policy rate, so the remedy would deliver the outcome it is meant to prevent.
Next week's prices decide September 16
The Producer Price Index (PPI) lands Thursday, September 10 at 12:30 GMT with the headline forecast at 0.3% MoM after a flat July and the core measure at 0.3% after 0.2%, against 4.7% and 4.2% YoY. The Consumer Price Index (CPI) follows Friday, September 11 at 12:30 GMT with the headline seen at 0.4% MoM after 0.1% and 3.4% YoY, and core at 0.2% after 0.2% and 2.5% YoY.
The governors who leaned toward a hold made it conditional on monthly inflation moderating, and a 0.4% headline consensus is not moderation but the energy channel. Diesel reached a record $5.85 a gallon nationally on Friday, close to 60% above a year ago, with refining capacity knocked out in Russia by Ukrainian drones and in the Gulf by a war that resumed American strikes on Iran this week, while Brent Crude Oil trades near $95.00. A core print at 0.2% is the hold's last argument, and a Chair who has said the Fed has work to do is not its audience.
Levels to watch
Resistance: The 53,500 handle is the first hurdle, the shelf Thursday built on and the level the index held for an hour after the print before the second leg took it away. Beyond that sit the cash open's high just above 53,600, the session high just above 53,700 and the 53,800 band that capped every rally from August 14 through August 28, then 54,000 and the record just short of 54,750, roughly 2.5% overhead.
Support: The 53,250 area is the first floor, where Wednesday's high and Tuesday's open cluster, with the session low just under 53,300 resting on it. Beneath that is 53,000 with Thursday's low just above it, then the rising 50-day Exponential Moving Average (EMA) near 52,800, the line under the entire August advance and the one that held Tuesday's low. The 200-day EMA just above 50,000 is not in play.
Bias: Bearish while the index holds beneath 53,500, with 53,250 the first objective and 53,000 behind it, and the 50-day EMA near 52,800 the target for a CPI week that prints at consensus or hotter. The daily Stochastic Relative Strength Index (Stoch RSI) near 38 has barely moved off Wednesday's trough despite a 300-point session, so momentum has not confirmed the break yet, and the five-minute reading near 49 rising out of oversold is the bounce from the low rather than a reversal. A daily close back above 53,500 restores Thursday's breakout and puts 53,800 back on the board.
Dow Jones 5-minute chart
Dow Jones FAQs
The Dow Jones Industrial Average, one of the oldest stock market indices in the world, is compiled of the 30 most traded stocks in the US. The index is price-weighted rather than weighted by capitalization. It is calculated by summing the prices of the constituent stocks and dividing them by a factor, currently 0.152. The index was founded by Charles Dow, who also founded the Wall Street Journal. In later years it has been criticized for not being broadly representative enough because it only tracks 30 conglomerates, unlike broader indices such as the S&P 500.
Many different factors drive the Dow Jones Industrial Average (DJIA). The aggregate performance of the component companies revealed in quarterly company earnings reports is the main one. US and global macroeconomic data also contributes as it impacts on investor sentiment. The level of interest rates, set by the Federal Reserve (Fed), also influences the DJIA as it affects the cost of credit, on which many corporations are heavily reliant. Therefore, inflation can be a major driver as well as other metrics which impact the Fed decisions.
Dow Theory is a method for identifying the primary trend of the stock market developed by Charles Dow. A key step is to compare the direction of the Dow Jones Industrial Average (DJIA) and the Dow Jones Transportation Average (DJTA) and only follow trends where both are moving in the same direction. Volume is a confirmatory criteria. The theory uses elements of peak and trough analysis. Dow’s theory posits three trend phases: accumulation, when smart money starts buying or selling; public participation, when the wider public joins in; and distribution, when the smart money exits.
There are a number of ways to trade the DJIA. One is to use ETFs which allow investors to trade the DJIA as a single security, rather than having to buy shares in all 30 constituent companies. A leading example is the SPDR Dow Jones Industrial Average ETF (DIA). DJIA futures contracts enable traders to speculate on the future value of the index and Options provide the right, but not the obligation, to buy or sell the index at a predetermined price in the future. Mutual funds enable investors to buy a share of a diversified portfolio of DJIA stocks thus providing exposure to the overall index.














