

Dow Jones Industrial Average repays the Treasury's rally with interest
- DJIA closed just beneath 52,800, down 687 points and on its lows.
- Walmart down more than 9%, its worst session in over four years.
- 10-year yield near 4.70%, back above its pre-buyback level.
Wednesday bought the bond market one session of calm and the Dow Jones Industrial Average spent Thursday paying for it with interest. The index closed just beneath 52,800, down 687 points and 1.29% on the day, within a dozen points of its session low and beneath the 53,000 handle for the first time this month. Every prop the previous session leaned on was pulled out inside a single afternoon.

The relief that lasted one session
Long-end yields reversed the entire move the buyback plan had produced. The 10-year note finished around 4.70%, back above where it stood before Wednesday morning's decision to at least double liquidity-support repurchases in the 10-year to 30-year sector from September 9, and the 30-year ended near 5.25% after touching its highest in almost two decades earlier in the week. The Treasury Secretary used a television appearance during the session to say the operations could run past 4 billion Dollars per issue.
He argued that yields do not reflect the underlying fundamentals, that liquidity at the long end is badly impaired, and that the Iran conflict is a temporary distortion the market will eventually see past. Yields eased while he spoke and then resumed climbing. A repurchase facility is a liquidity instrument, and the afternoon spent six hours pointing out that liquidity was never the complaint.
What the facility actually does is fund the long end out of the front, retiring 10-year to 30-year paper while the financing shifts toward bills, and it manages that without touching the Fed's balance sheet. Sell-side commentary through the afternoon reduced it to a thin imitation of Operation Twist, on the argument that 4 billion Dollars an operation is not a meaningful share of a market this size. Federal debt passed 40 trillion Dollars on Wednesday, four months after clearing 39 trillion, which is the number the long end has actually been trading.
Where the war reaches the household
Walmart fell more than 9%, its steepest single-session decline in over four years, after comparable United States store sales rose 2.6% against a 3.8% consensus and average ticket growth slowed to 1.1% from 3.1% a year earlier. The company put the trade-down down to what its customers are paying at the pump. Crude Oil traded above $87.00, the highest in close to a month, after an unprecedented economic isolation campaign against Iran was declared on Wednesday evening.
The retailer beat on earnings and nudged its annual sales and profit targets higher for the first time this year, and the market sold it anyway. Operating income carried a benefit of 750 basis points from tariff refunds, so the reported figure was flattered by a policy reversal rather than by demand. Consumer staples led the wider market lower and rival retailers followed. This is the war showing up in an index component's revenue line rather than in a barrel price.
The composition alibi ran the other way
The Dow lost 1.29% against roughly 0.85% for the S&P 500 and 1% for the Nasdaq Composite, which inverts the pattern the summer has run on. Price weighting and membership have been the reason this average outperformed through earnings season and through every war headline since June. On Thursday they were the reason it underperformed.
A price-weighted average built on consumer, industrial and healthcare names is the wrong instrument to hold when the shock is an energy tax on the household rather than a multiple problem in technology. The index ended roughly 3.6% beneath the August 5 record, having lost the 53,250 shelf and the 53,000 handle in one afternoon.
Friday's flash surveys, then Wyoming
Friday August 21 at 13:45 GMT brings the preliminary August S&P Global Purchasing Managers Index (PMI) surveys, two of the three carrying red-band billing. The manufacturing consensus sits at 53.8 against a 53.9 prior and services at 54 against 54.6, with the composite last at 54.5. A firm reading feeds the inflation case that has driven the long end all summer, which makes a beat the unfriendly outcome here.
The week after brings Jackson Hole on August 27-29 and the chair's first symposium keynote. The tension is now explicit, because the bond market has been doing tightening work the Fed never had to vote for and the Treasury spent this week trying to undo it. Whether the chair accepts that help or leans against it is the question the front end has left.
Dow Jones Industrial Average levels
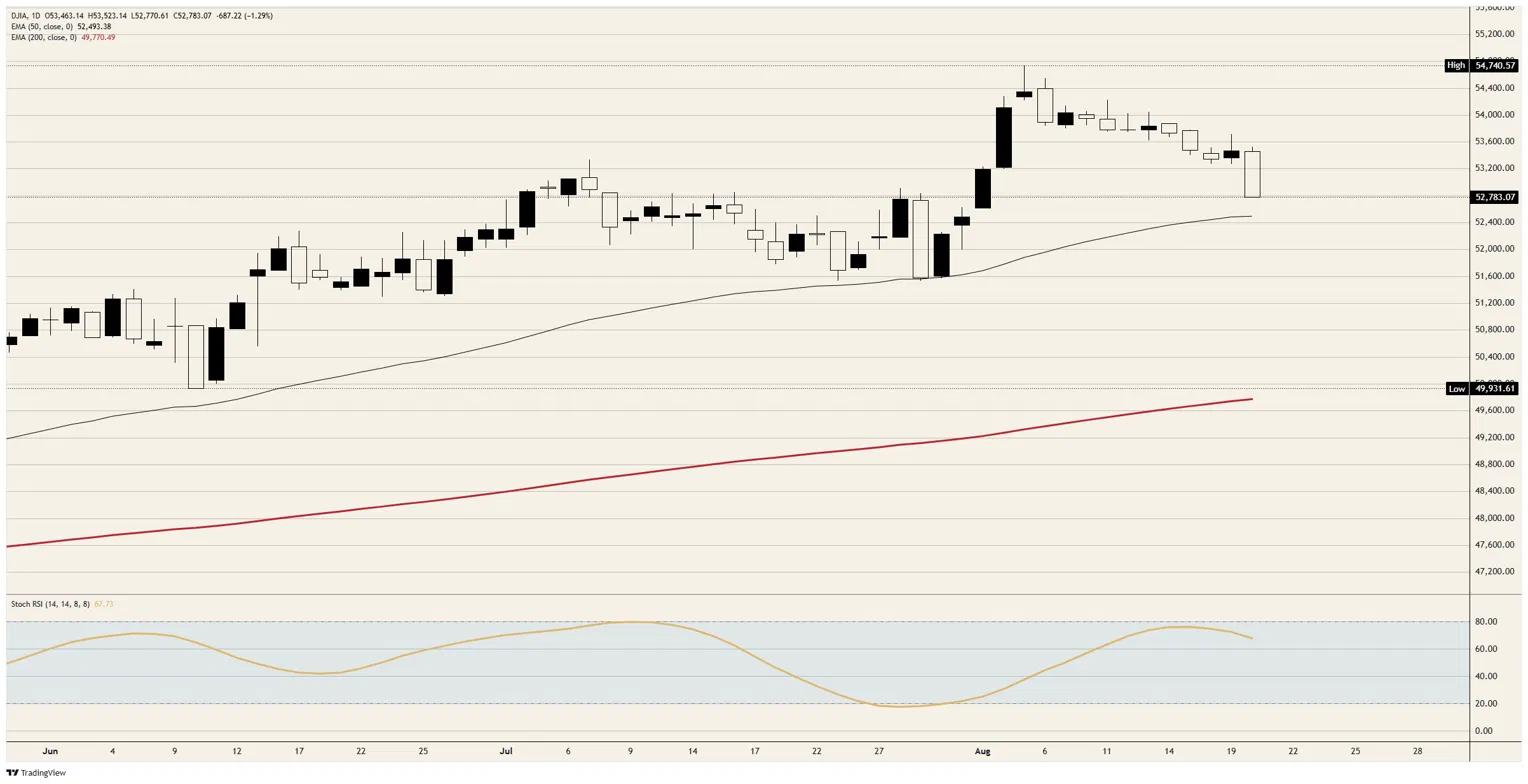
Resistance: The 53,000 handle is the level lost on the way down and the first one to reclaim. Above it sits the 53,500 area that capped Thursday's session, then the 53,800 shelf that has turned back every attempt this month.
Support: The 50-day Exponential Moving Average (EMA) near 52,500 is the first structure beneath, roughly 290 points lower and still rising, with the 52,250 area the next reference under that. Daily Stochastic Relative Strength Index (Stoch RSI) near 68 is nowhere near oversold, so the indicator argues nothing about this fall being over.
Bias: Bearish beneath the 53,000 handle. Objectives are the 50-day EMA near 52,500 and then 52,250, with invalidation on a daily close back above 53,250.
Dow Jones daily chart
Dow Jones FAQs
The Dow Jones Industrial Average, one of the oldest stock market indices in the world, is compiled of the 30 most traded stocks in the US. The index is price-weighted rather than weighted by capitalization. It is calculated by summing the prices of the constituent stocks and dividing them by a factor, currently 0.152. The index was founded by Charles Dow, who also founded the Wall Street Journal. In later years it has been criticized for not being broadly representative enough because it only tracks 30 conglomerates, unlike broader indices such as the S&P 500.
Many different factors drive the Dow Jones Industrial Average (DJIA). The aggregate performance of the component companies revealed in quarterly company earnings reports is the main one. US and global macroeconomic data also contributes as it impacts on investor sentiment. The level of interest rates, set by the Federal Reserve (Fed), also influences the DJIA as it affects the cost of credit, on which many corporations are heavily reliant. Therefore, inflation can be a major driver as well as other metrics which impact the Fed decisions.
Dow Theory is a method for identifying the primary trend of the stock market developed by Charles Dow. A key step is to compare the direction of the Dow Jones Industrial Average (DJIA) and the Dow Jones Transportation Average (DJTA) and only follow trends where both are moving in the same direction. Volume is a confirmatory criteria. The theory uses elements of peak and trough analysis. Dow’s theory posits three trend phases: accumulation, when smart money starts buying or selling; public participation, when the wider public joins in; and distribution, when the smart money exits.
There are a number of ways to trade the DJIA. One is to use ETFs which allow investors to trade the DJIA as a single security, rather than having to buy shares in all 30 constituent companies. A leading example is the SPDR Dow Jones Industrial Average ETF (DIA). DJIA futures contracts enable traders to speculate on the future value of the index and Options provide the right, but not the obligation, to buy or sell the index at a predetermined price in the future. Mutual funds enable investors to buy a share of a diversified portfolio of DJIA stocks thus providing exposure to the overall index.













