


Bitcoin Price Forecast: Rising yields, stronger US Dollar cap BTC upside
- Bitcoin remains under pressure, slipping below $86,000 on Tuesday as profit-taking activity intensifies.
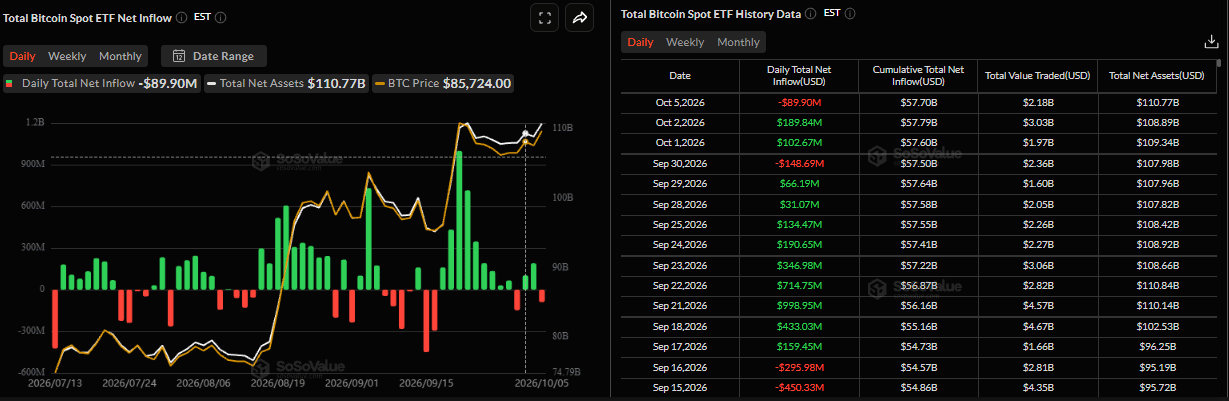
- US-listed spot ETFs recorded a mild outflow of $89.90 on Monday, while Strategy added 334 BTC to its reserve.
- Rising US Treasury yields and a stronger US Dollar are weighing on BTC and could limit its upside.
Bitcoin (BTC) remains under pressure, trading below $86,000 at the time of writing on Tuesday, as profit-taking intensifies. Mixed sentiment among corporate and institutional demand as Strategy (MSTR) added 334 BTC to its reserves while spot Exchange Traded Funds (ETFs) recorded a mild $89.90 million outflow on Monday.

Moreover, rising US Treasury yields and a stronger US Dollar (USD) are creating additional headwinds for the Crypto King and raising doubts about whether BTC's bullish momentum can sustain.
Institutional demand cools
Institutional demand started the week with mild cautionary signs. SoSoValue data showed that BTC spot ETFs recorded a mild outflow of $89.90 million on Monday, snapping the two-day inflows streak since last week. If this outflow trend continues and intensifies throughout this week, BTC could extend its pullback.
On the corporate side, Michael Saylor announced on Monday that his firm, Strategy, acquired another 334 BTC last week, continuing its three-week buying streak (1,665 BTC and 950 BTC).
The company currently holds 848,000 BTC and its total reserves are $5.70 billion in USD Assets. The move suggests Saylor’s company is returning to its familiar approach of aggressively accumulating BTC, supporting a bullish outlook for BTC.
Rising US yields and stronger US Dollar weigh on BTC
Bitcoin bulls are losing momentum, with the Crypto King remaining under pressure around its recent high at $87,000 and consolidating below this zone.
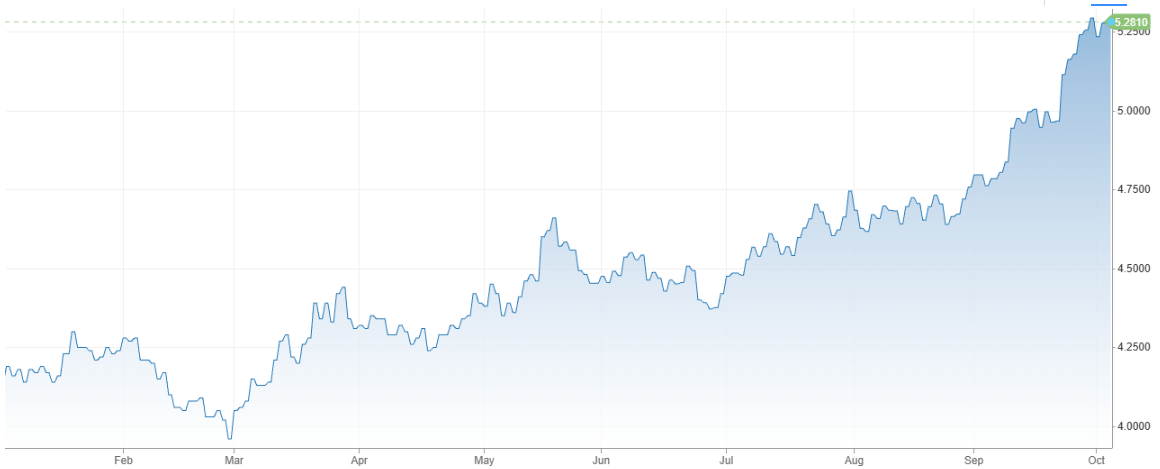
The 10-year US Treasury yield, as shown in the chart below, rose and posted a fresh two-decade high near 5.35% on Monday, now holding strong around 5.28%. These higher yields make traditional fixed-income assets more attractive than risky assets such as BTC.
In addition, a stronger Greenback further weighs on BTC, with the US Dollar Index (DXY) reaching an intraday high of $102.53 on Monday, reaching levels not seen since early April 2025.
“Cryptocurrencies are finding support in reduced expectations of an October rate hike, institutional purchases, and the expansion of projects connecting blockchain with traditional finance,” Simon-Peter Massabni, Head of Business Development at XS.com, said to FXStreet in an exclusive interview.
However, elevated US Treasury yields, a stronger US Dollar and persistent inflationary pressures continue to weigh on market sentiment. For a sustained recovery, bullish momentum needs to broaden across more crypto assets and be supported by persistent demand. Investors will also need to distinguish between genuine adoption, growth expectations and speculative price movements.
Profit-taking activity surges to a new yearly high
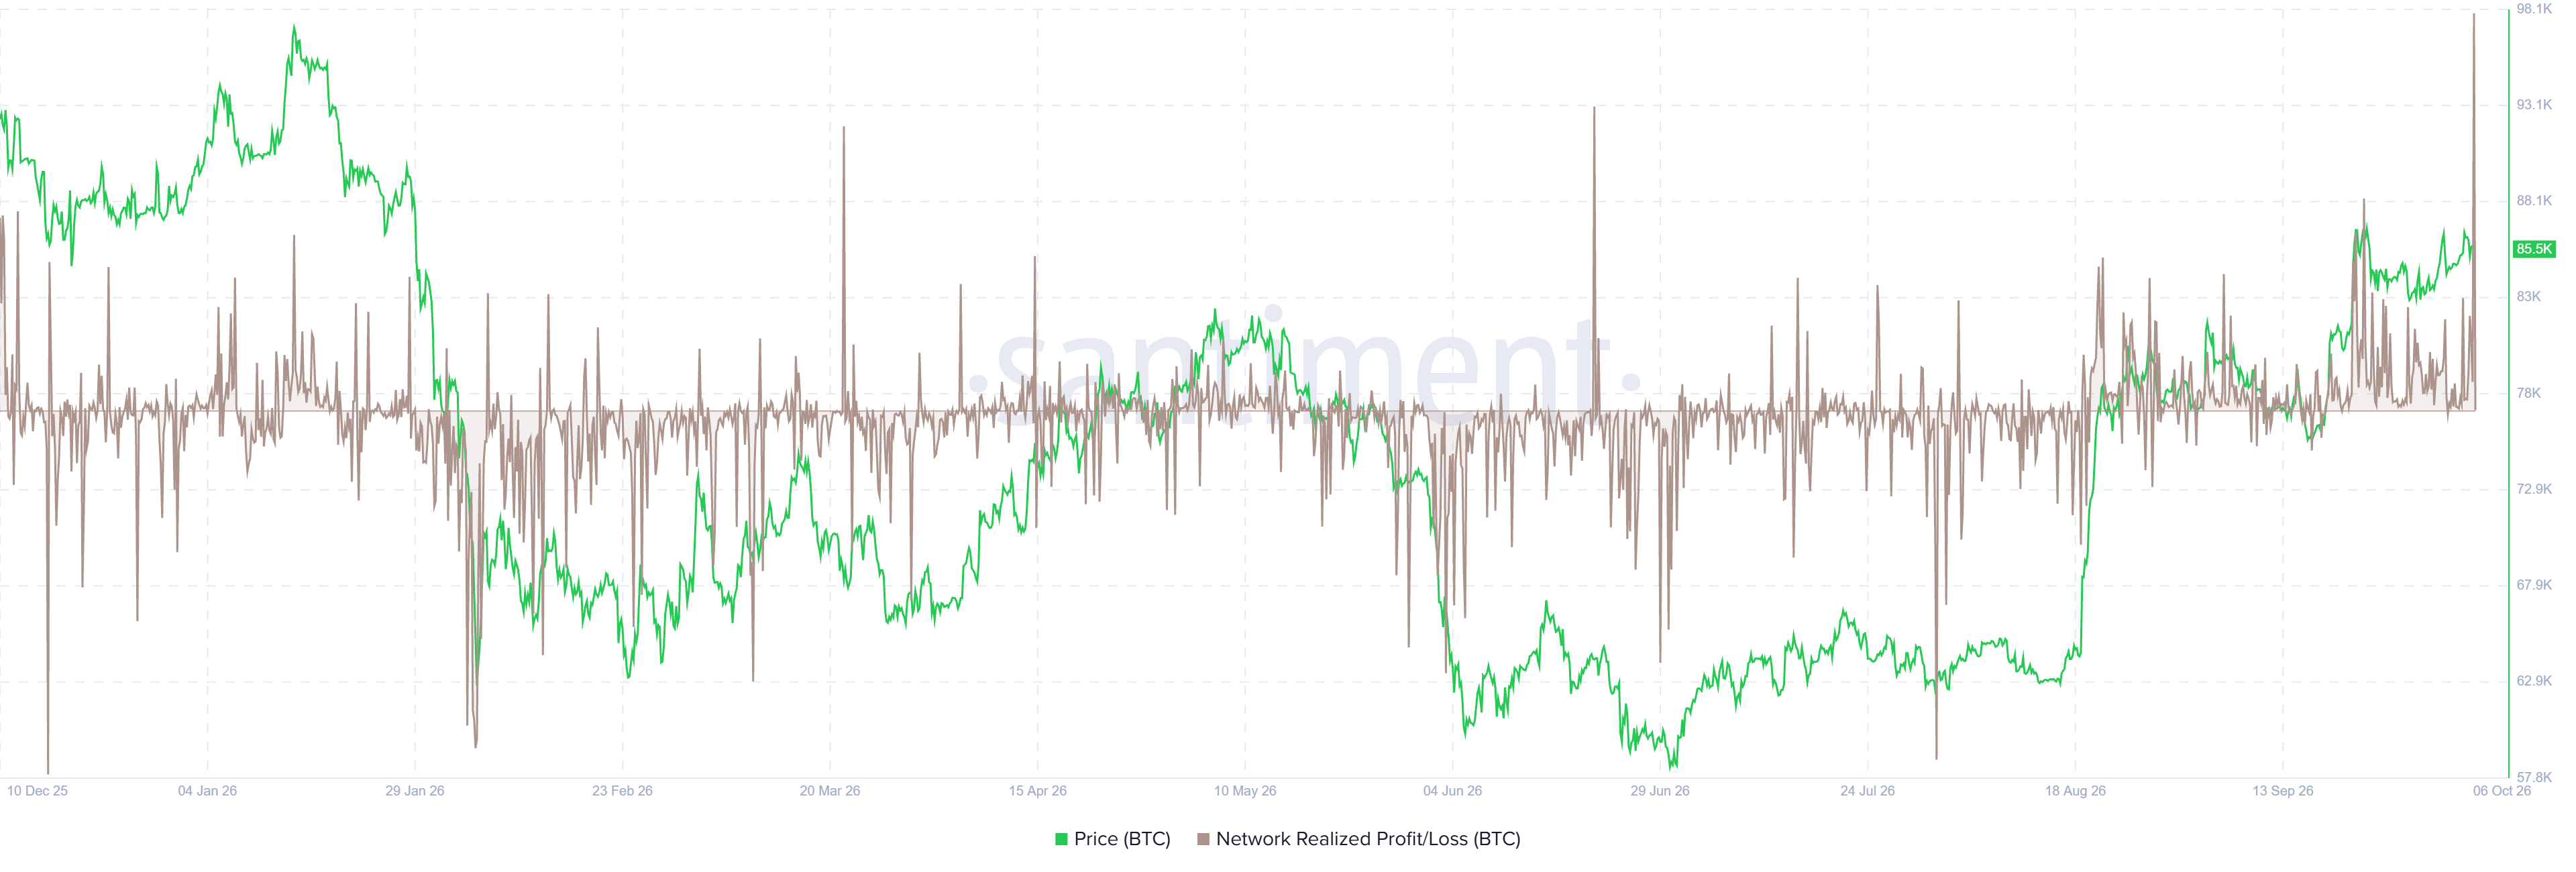
Santiment’s Network Realized Profit/Loss (NPL) metric indicates Bitcoin holders are booking profits, weighing on BTC price in the near term.
As shown in the chart below, the metric spiked sharply on Monday, reaching its highest level since November 23, 2025. This spike indicates that holders are, on average, selling their bags at a significant profit, thereby increasing the selling pressure.
Bitcoin technical outlook: BTC holds key $85,000 support
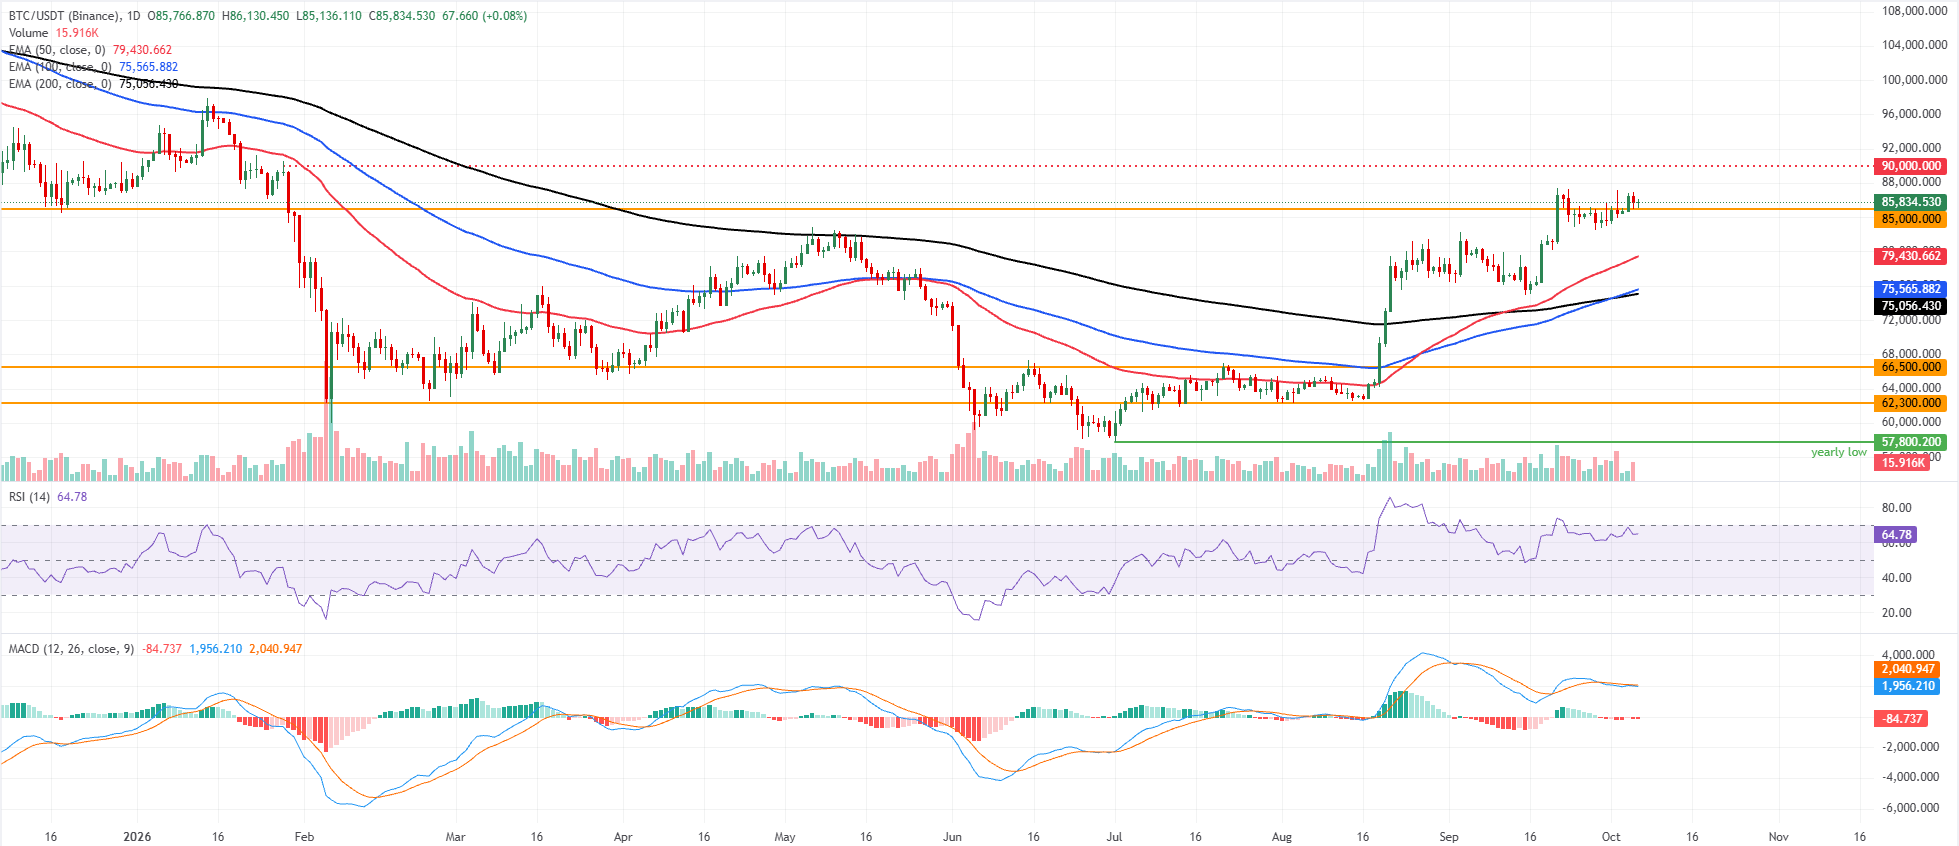
Bitcoin price trades at $85,834 on Tuesday after a mild correction the previous day. Despite the pullback, BTC is sustaining a bullish near-term bias as it holds comfortably above the 50-day, 100-day, and 200-day Exponential Moving Average (EMA) at $79,430, $75,565, and $75,056, respectively.
The cluster of medium- and long-term EMAs below price hints at a well-supported uptrend, while the Relative Strength Index (RSI) at 64 stays in positive territory without yet reaching overbought conditions, suggesting buyers still retain control despite a mildly negative Moving Average Convergence Divergence (MACD) histogram reading, with the MACD line below zero and subdued momentum.
On the downside, immediate support is seen at the nearby horizontal level around $85,000, followed by the 50-day EMA at $79,430, which would be the first significant dynamic floor on a deeper pullback. Further down, the 100-day EMA at $75,565 and the 200-day EMA at $75,056 reinforce a broader bullish structure, before more distant horizontal levels at $66,500 and $62,300 mark major medium-term demand zones.
(The technical analysis of this story was written with the help of an AI tool. Know more.)
Bitcoin, altcoins, stablecoins FAQs
Bitcoin is the largest cryptocurrency by market capitalization, a virtual currency designed to serve as money. This form of payment cannot be controlled by any one person, group, or entity, which eliminates the need for third-party participation during financial transactions.
Altcoins are any cryptocurrency apart from Bitcoin, but some also regard Ethereum as a non-altcoin because it is from these two cryptocurrencies that forking happens. If this is true, then Litecoin is the first altcoin, forked from the Bitcoin protocol and, therefore, an “improved” version of it.
Stablecoins are cryptocurrencies designed to have a stable price, with their value backed by a reserve of the asset it represents. To achieve this, the value of any one stablecoin is pegged to a commodity or financial instrument, such as the US Dollar (USD), with its supply regulated by an algorithm or demand. The main goal of stablecoins is to provide an on/off-ramp for investors willing to trade and invest in cryptocurrencies. Stablecoins also allow investors to store value since cryptocurrencies, in general, are subject to volatility.
Bitcoin dominance is the ratio of Bitcoin's market capitalization to the total market capitalization of all cryptocurrencies combined. It provides a clear picture of Bitcoin’s interest among investors. A high BTC dominance typically happens before and during a bull run, in which investors resort to investing in relatively stable and high market capitalization cryptocurrency like Bitcoin. A drop in BTC dominance usually means that investors are moving their capital and/or profits to altcoins in a quest for higher returns, which usually triggers an explosion of altcoin rallies.
인기 기사
1Crypto Today: Bitcoin, Ethereum, XRP bulls battle to restart uptrend amid ETF outflows2Equities: Resilience persists versus rates stress – Deutsche Bank3Bitcoin Price Forecast: Rising yields, stronger US Dollar cap BTC upside4Euro: Political risks keep EUR under pressure against US Dollar – MUFG5Pi Network Price Forecast: PI pauses decline amid Protocol v28 release on the testnet6Silver price today: Silver broadly unchanged, according to FXStreet data7US Dollar: Staying supported as Fed hike base case – ING8Canadian Dollar falls to near 18-month lows as oil prices decline9Eurozone Retail Sales rises 0.1% MoM in August, misses 0.2% estimates
실시간 시세

TECHNICAL에 대한 모든 것
ICT 트레이딩이란 무엇인가요? 이너 서클 트레이더(Inner Circle Trader) 개념 설명
지지선과 저항선: 의미, 유형, 레벨을 그리는 방법 및 트레이딩 전략
유동성이란 무엇인가요? 트레이딩 및 금융시장에서의 의미
유동성 스윕: 의미, 예시 및 트레이딩 전략
트레이딩의 시장 구조: 완벽 가이드 (상승장, 하락장, 횡보장)
캐릭터 변화 (CHoCH): 정의, 예시 및 전략
다크 클라우드 커버 패턴이란 무엇이며, 이를 어떻게 트레이딩하나요?
피어싱 라인 캔들스틱 패턴이란 무엇이며, 이를 어떻게 트레이딩하나요?
트위저 탑 및 바닥 캔들스틱 패턴이란 무엇인가요?

소셜 미디어












이 웹사이트에 제공된 정보는 일반적인 성격의 정보일 뿐이며 개인 맞춤형 금융 자문을 구성하지 않습니다. 이 웹사이트의 정보를 바탕으로 행동하기 전에, 귀하의 목표, 재정 상황 및 필요에 비추어 해당 정보의 적합성을 고려해야 합니다. CFD 및 FX 마진 계약에 대한 투자는 상당한 위험을 수반하며 모든 투자자에게 적합하지 않을 수 있습니다. 귀하는 최초 예치금보다 더 큰 손실을 입을 수 있습니다. 귀하는 기초자산에 대한 소유권이나 어떠한 이해관계도 보유하지 않습니다. 거래를 시작하기 전에 독립적인 자문을 구하고 관련 위험을 충분히 이해하시기를 권장합니다. 웹사이트에 기재된 상품을 취득하기 전에 공시 문서를 읽고 검토하는 것이 중요합니다. 이 웹사이트에서 제공되는 정보 및 광고는 그러한 사용이 현지 법률 및 규정에 위배되는 국가 또는 관할권의 개인이 사용하도록 의도된 것이 아닙니다. 이 웹사이트에서 제공되는 상품 및 서비스는 미국, 말레이시아 및 태국 거주자를 대상으로 하지 않습니다.
TMGM은 다양한 관할권에서 승인 및 규제를 받고 있습니다.
TMGM으로 거래하는 Trademax Australia Limited는 호주 증권투자위원회(ASIC)의 규제를 받으며, AFSL 번호 436416이고 Level 28, One International Tower, 100 Barangaroo Avenue, 2000 Sydney, NSW Australia에 위치하고 있습니다.
이메일: [email protected]
TMGM으로 거래하는 Trademax Global Limited는 바누아투 금융서비스위원회(VFSC)의 승인 및 규제를 받으며, 등록 번호 40356이고 1276, Kumul Highway, Port Vila, Vanuatu, Republic of Vanuatu에 등록되어 있습니다.
이메일: [email protected]
Trademax Global Markets (SE) Limited(이하 TMGM)는 세이셸 금융청(FSA)의 인가 및 규제를 받으며, 허가 번호는 SD224입니다. 회사는 세이셸 마헤, 프로비던스 에스테이트 ABIS 센터, 사무실 번호 13에 등록되어 있습니다.
이메일: [email protected]
TMGM으로 거래하는 Trademax Global Markets (International) Pty Ltd는 모리셔스 금융서비스위원회(FSC)의 승인 및 규제를 받으며 라이선스 번호 GB22201012이고, 33, Edith Cavell Street C/o IQ EQ Fund Services (Mauritius) Ltd Port Louis, 11324 Mauritius에 등록되어 있습니다.
이메일: [email protected]
Copyright © TMGM. All rights reserved