


British Pound catches bid as Fed’s Waller eyes a pause in October
- GBP/USD climbs 0.14% after finding support near 1.3184.
- Waller says Fed hikes need not occur at consecutive meetings.
- Markets see 83% odds of a 25bp BoE hike.
The Pound Sterling advances some 0.14% on Thursday as the US Dollar weakens even though US jobs data was positive, but dovish comments by Fed Governor Waller weighed on the Greenback. The GBP/USD trades at 1.3230, after bottoming at 1.3184.
Sterling rebounds as softer Fed expectations offset solid US jobless claims data
The US Department of Labour reported that Initial Jobless Claims for the week ending October 3 came in at 197K, below forecasts of 200K and down from the previous week's downward-revised print of 199K. An analyst cited by Reuters revealed that “It's still a 'low-hire, low-fire' job market,” which is good for people who already have a job, but tough for someone looking to enter the workforce.

The data came after the latest US jobs report revealed that the labour market is slightly consistent with maximum employment.
Recently, Fed Governor Christopher Waller commented that rate hikes need not occur at consecutive meetings, a hint that the central bank will pause in October. However, he said that more hikes are likely needed to curb inflation but that there’s some flexibility over the pace of tightening.
On Wednesday, the latest Fed minutes revealed that all members backed September’s rate hike and that the board sees the labor market as “stable and generally viewed … as close to maximum employment.”
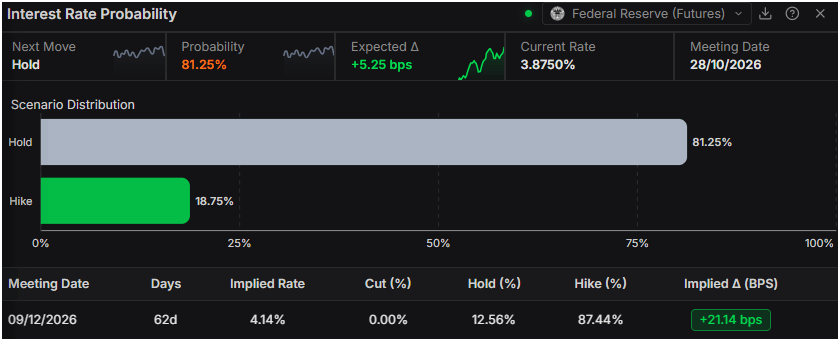
Given the backdrop, money markets have priced out a potential rate hike by the Fed in October, with the odds at a minimal 18%, while for December, they remain at 87%, according to Prime Terminal.
In the UK, Bank of England (BoE) Governor Andrew Bailey stated that monetary policy must remain focused on inflation in a speech at a conference in Turkey on Thursday. Bailey added that governments need to double down on fixing the fiscal deficits, and that it must be “credible and directed at stability.”
BoE interest rate probabilities reveal an 83% chance of a 25-basis-point rate hike by the central bank, which would push the Bank Rate to 4%. For the December meeting, the odds are 92%, revealed Prime Terminal.
Therefore, if the Fed and the BoE finish the year raising rates twice, the interest rate differential would remain flat, which could increase the appeal for Sterling, which has weakened on US Dollar strength and fears for a fiscal disaster.
Ahead, the US economic docket will feature the University of Michigan Consumer Sentiment. In the UK, the docket is absent.
GBP/USD Price Forecast: Technical outlook
In the daily chart, GBP/USD trades at 1.3212, extending its slide below a dense band of former supports that have turned into resistance, keeping the near-term bias bearish. The latest reading of the 50/100/200-day simple moving averages (SMA) cluster around 1.3443, now well above spot and reinforcing the idea of a market capped by medium-term trend resistance. Momentum is weak, with the 14-day Relative Strength Index hovering near 36, which hints at persistent selling pressure but not yet extreme oversold conditions, while the latest FXS Fed Sentiment Index print at 137.91 suggests a still-firm dollar backdrop weighing on the pair.
On the topside, initial resistance emerges at the former trend-line break near 1.3300, followed by the downward-sloping resistance trend line breaking around 1.3425 and the SMA cluster at roughly 1.3443. Above there, a reclaimed move toward 1.3568 and 1.3764—both prior rising-support break levels—would be needed to undermine the current bearish structure. With no meaningful technical support immediately below the market and price pressing its recent lows, the pair remains vulnerable to further downside until buyers can force a sustained recovery above the 1.3300 area.
(The technical analysis of this story was written with the help of an AI tool. Know more.)
Pound Sterling Price Today
The table below shows the percentage change of British Pound (GBP) against listed major currencies today. British Pound was the strongest against the Australian Dollar.
| USD | EUR | GBP | JPY | CAD | AUD | NZD | CHF | |
|---|---|---|---|---|---|---|---|---|
| USD | 0.05% | 0.04% | 0.11% | -0.07% | 0.29% | 0.09% | -0.01% | |
| EUR | -0.05% | -0.01% | 0.09% | -0.12% | 0.16% | 0.05% | -0.06% | |
| GBP | -0.04% | 0.00% | 0.10% | -0.11% | 0.18% | 0.08% | -0.02% | |
| JPY | -0.11% | -0.09% | -0.10% | -0.21% | 0.08% | -0.07% | -0.13% | |
| CAD | 0.07% | 0.12% | 0.11% | 0.21% | 0.29% | 0.17% | 0.09% | |
| AUD | -0.29% | -0.16% | -0.18% | -0.08% | -0.29% | -0.10% | -0.21% | |
| NZD | -0.09% | -0.05% | -0.08% | 0.07% | -0.17% | 0.10% | -0.05% | |
| CHF | 0.00% | 0.06% | 0.02% | 0.13% | -0.09% | 0.21% | 0.05% |
The heat map shows percentage changes of major currencies against each other. The base currency is picked from the left column, while the quote currency is picked from the top row. For example, if you pick the British Pound from the left column and move along the horizontal line to the US Dollar, the percentage change displayed in the box will represent GBP (base)/USD (quote).
인기 기사
1US President Trump rules out Iran strike before midterms, talks resume2Dollar Index flatlines as Fed Governor Waller puts no date on more hikes3Crude Oil grinds higher on record tanker attacks and Houthi missiles4Banxico minutes flags upside inflation risks despite 6.50% rate hold5Australian Dollar slips as hawkish Fed, elevated US yields sustain USD6British Pound catches bid as Fed’s Waller eyes a pause in October7Silver Price Forecast: XAG/USD slides below $60 as sellers retain control8Mexican Peso: Watching support for reversal signal against US Dollar – Societe Generale9Ripple Price Forecast: XRP risks losing the 50-day EMA support as exchange reserves rise
실시간 시세



소셜 미디어












이 웹사이트에 제공된 정보는 일반적인 성격의 정보일 뿐이며 개인 맞춤형 금융 자문을 구성하지 않습니다. 이 웹사이트의 정보를 바탕으로 행동하기 전에, 귀하의 목표, 재정 상황 및 필요에 비추어 해당 정보의 적합성을 고려해야 합니다. CFD 및 FX 마진 계약에 대한 투자는 상당한 위험을 수반하며 모든 투자자에게 적합하지 않을 수 있습니다. 귀하는 최초 예치금보다 더 큰 손실을 입을 수 있습니다. 귀하는 기초자산에 대한 소유권이나 어떠한 이해관계도 보유하지 않습니다. 거래를 시작하기 전에 독립적인 자문을 구하고 관련 위험을 충분히 이해하시기를 권장합니다. 웹사이트에 기재된 상품을 취득하기 전에 공시 문서를 읽고 검토하는 것이 중요합니다. 이 웹사이트에서 제공되는 정보 및 광고는 그러한 사용이 현지 법률 및 규정에 위배되는 국가 또는 관할권의 개인이 사용하도록 의도된 것이 아닙니다. 이 웹사이트에서 제공되는 상품 및 서비스는 미국, 말레이시아 및 태국 거주자를 대상으로 하지 않습니다.
TMGM은 다양한 관할권에서 승인 및 규제를 받고 있습니다.
TMGM으로 거래하는 Trademax Australia Limited는 호주 증권투자위원회(ASIC)의 규제를 받으며, AFSL 번호 436416이고 Level 28, One International Tower, 100 Barangaroo Avenue, 2000 Sydney, NSW Australia에 위치하고 있습니다.
이메일: [email protected]
TMGM으로 거래하는 Trademax Global Limited는 바누아투 금융서비스위원회(VFSC)의 승인 및 규제를 받으며, 등록 번호 40356이고 1276, Kumul Highway, Port Vila, Vanuatu, Republic of Vanuatu에 등록되어 있습니다.
이메일: [email protected]
Trademax Global Markets (SE) Limited(이하 TMGM)는 세이셸 금융청(FSA)의 인가 및 규제를 받으며, 허가 번호는 SD224입니다. 회사는 세이셸 마헤, 프로비던스 에스테이트 ABIS 센터, 사무실 번호 13에 등록되어 있습니다.
이메일: [email protected]
TMGM으로 거래하는 Trademax Global Markets (International) Pty Ltd는 모리셔스 금융서비스위원회(FSC)의 승인 및 규제를 받으며 라이선스 번호 GB22201012이고, 33, Edith Cavell Street C/o IQ EQ Fund Services (Mauritius) Ltd Port Louis, 11324 Mauritius에 등록되어 있습니다.
이메일: [email protected]
Copyright © TMGM. All rights reserved