


Pepe Price Forecast: PEPE sustains mild recovery on firm retail support
- Pepe holds steady on Friday after a 3.50% rebound the previous day.
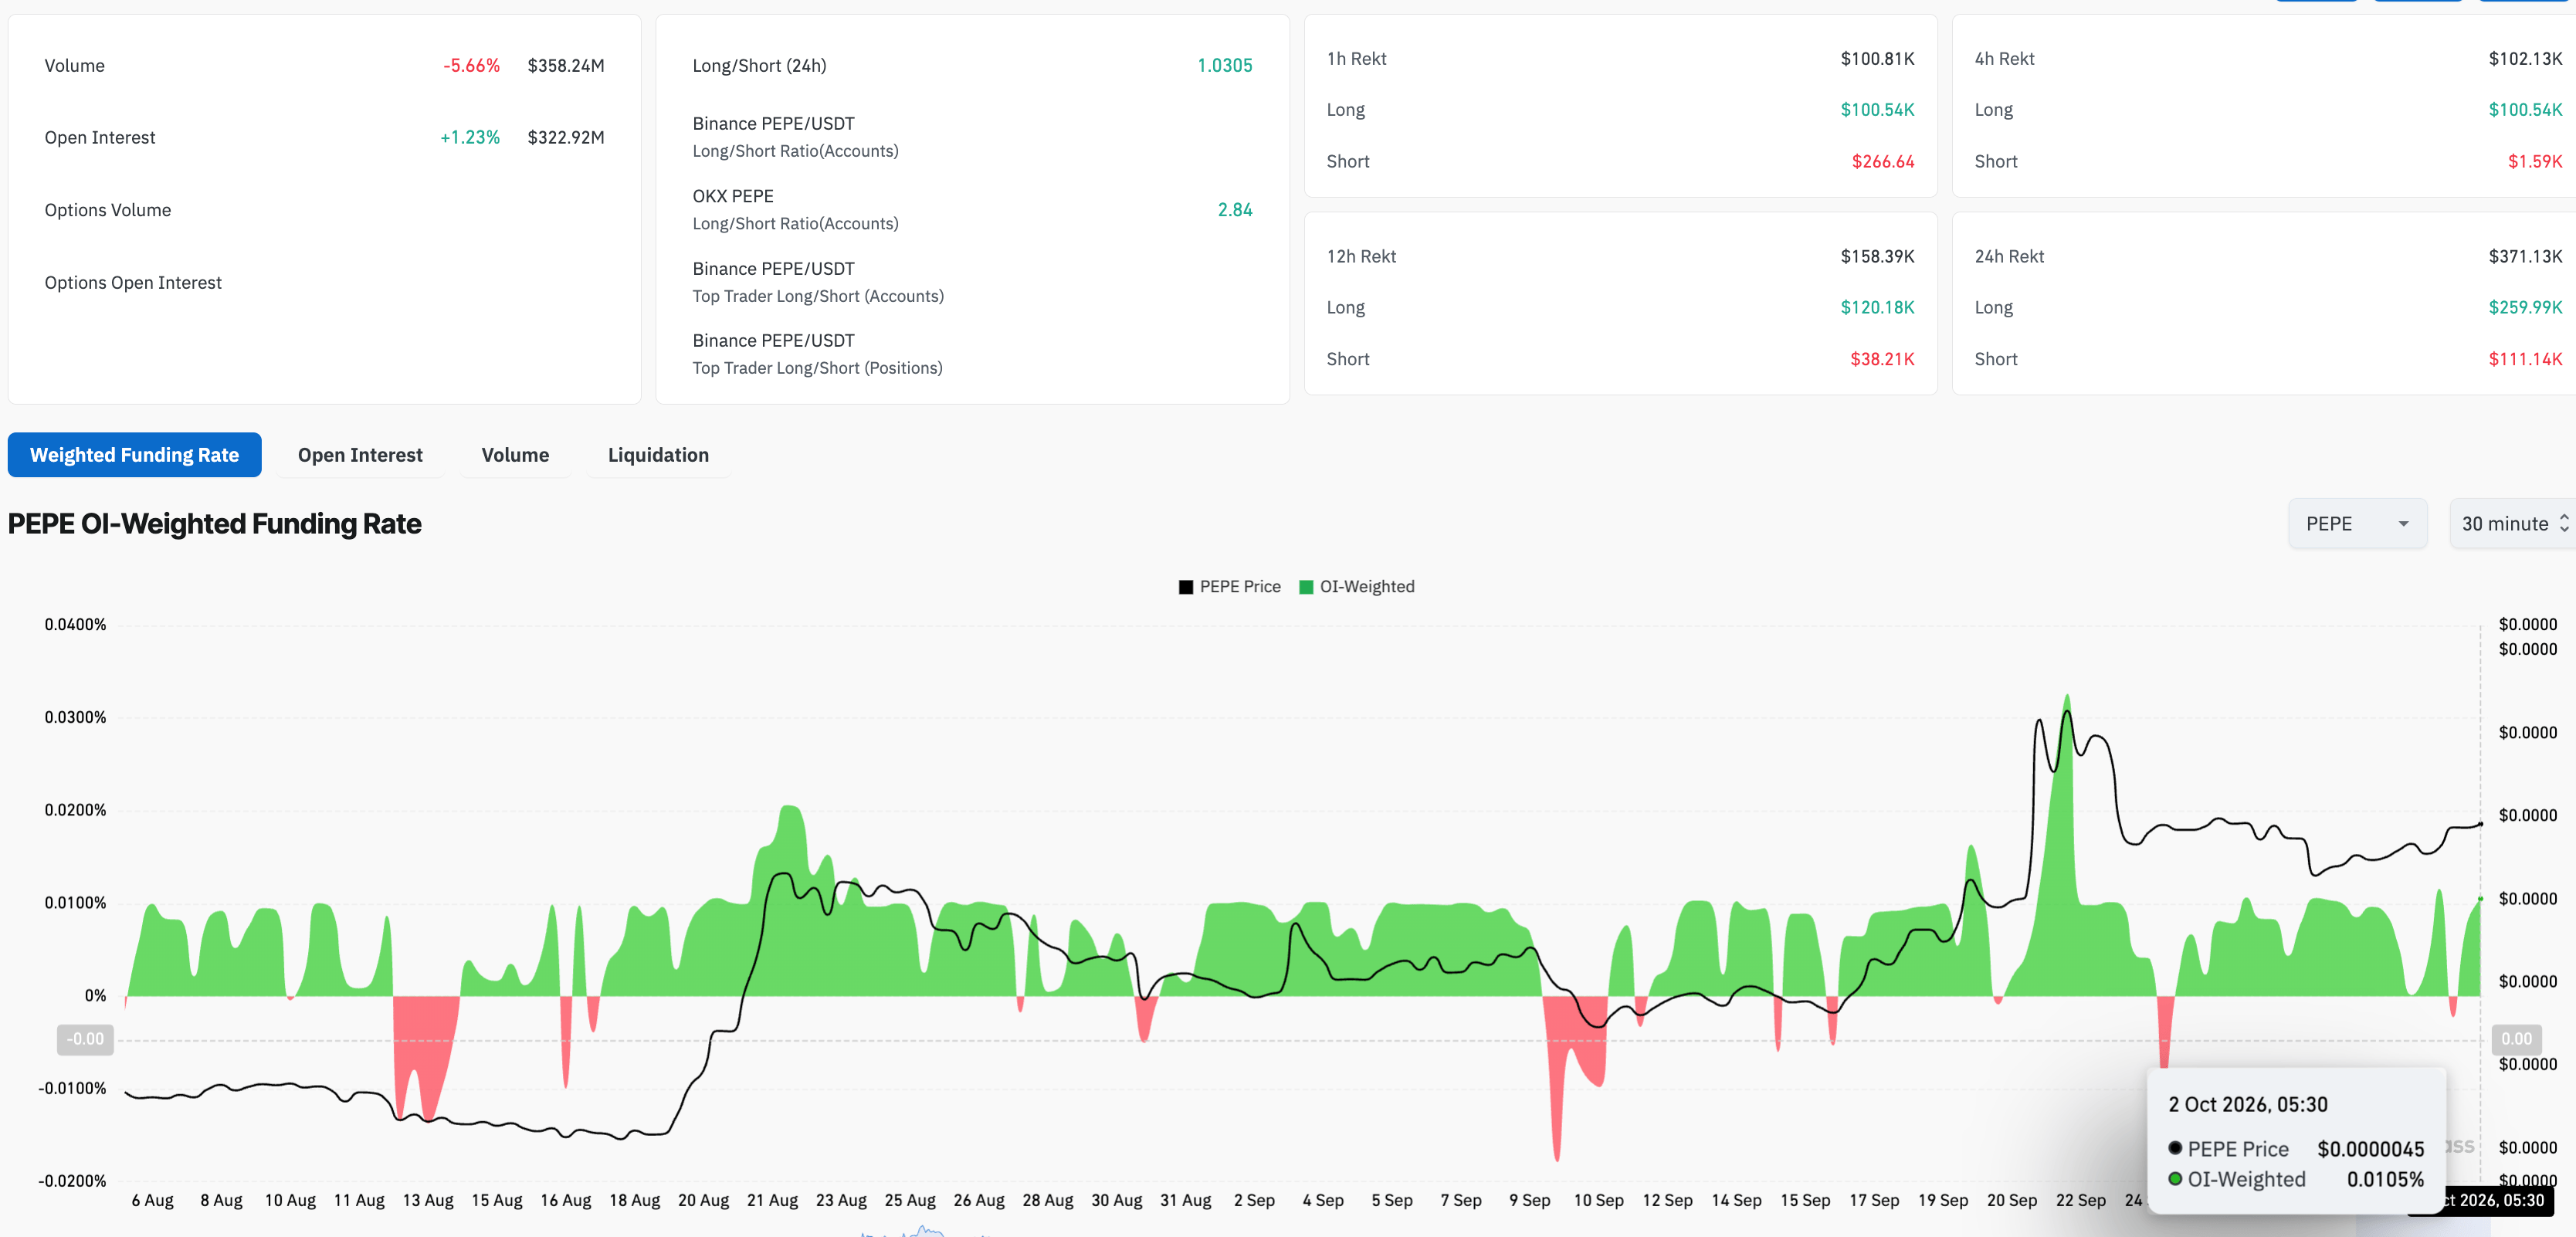
- Derivatives data shows firm positional buildup and a positive funding rate, suggesting firm retail demand.
- The technical outlook for PEPE is mildly bullish, with momentum recovering amid a Golden Cross.
Pepe (PEPE) price holds steady around $0.00000440 at press time on Friday, sustaining the 3.50% gains from the previous day's rebound. The meme coin maintains firm retail demand, with its futures Open Interest stabilizing above $320 million and funding rates remaining positive. PEPE must reclaim the $0.00000500 psychological barrier to sustain an upward trend.

Retail hope stays alive
The frog-themed meme coin, the third-largest based on market capitalization, retains firm retail support. CoinGlass data shows that PEPE futures Open Interest (OI) edged marginally higher over the last 24 hours to $322.92 million, indicating a steady buildup of open positions. Meanwhile, the funding rate remains positive at 0.0109%, suggesting strong demand among traders to buy long positions at a premium.
Technical outlook: PEPE's mild recovery could set the next bull run in motion
Pepe trades around $0.00000445 at press time on Friday, maintaining a constructive near-term bullish bias. The meme coin trades in the green for the fourth consecutive day, extending its rebound from Tuesday's low at $0.00000406.
PEPE hovers well above the 50-, 100-, and 200-day Exponential Moving Averages (EMAs) at around $0.00000379, $0.00000354, and $0.00000373, respectively, supporting the upside bias. In addition, the Golden Cross pattern between the 50- and 200-day EMAs backs the bullish trend reversal.
The near-term rebound so far this week suggests a post-retest rebound from the broken long-term resistance trendline. This could translate into a steady recovery if Pepe reclaims the $0.00000500 barrier, which capped gains last week. A confirmed breakout could target the 161.8% and 200% Fibonacci extension levels at $0.00000567 and $0.00000650, measured from $0.00000456 to $0.00000320.
At the same time, the Relative Strength Index (RSI) around 56 suggests supportive momentum rather than outright exhaustion.
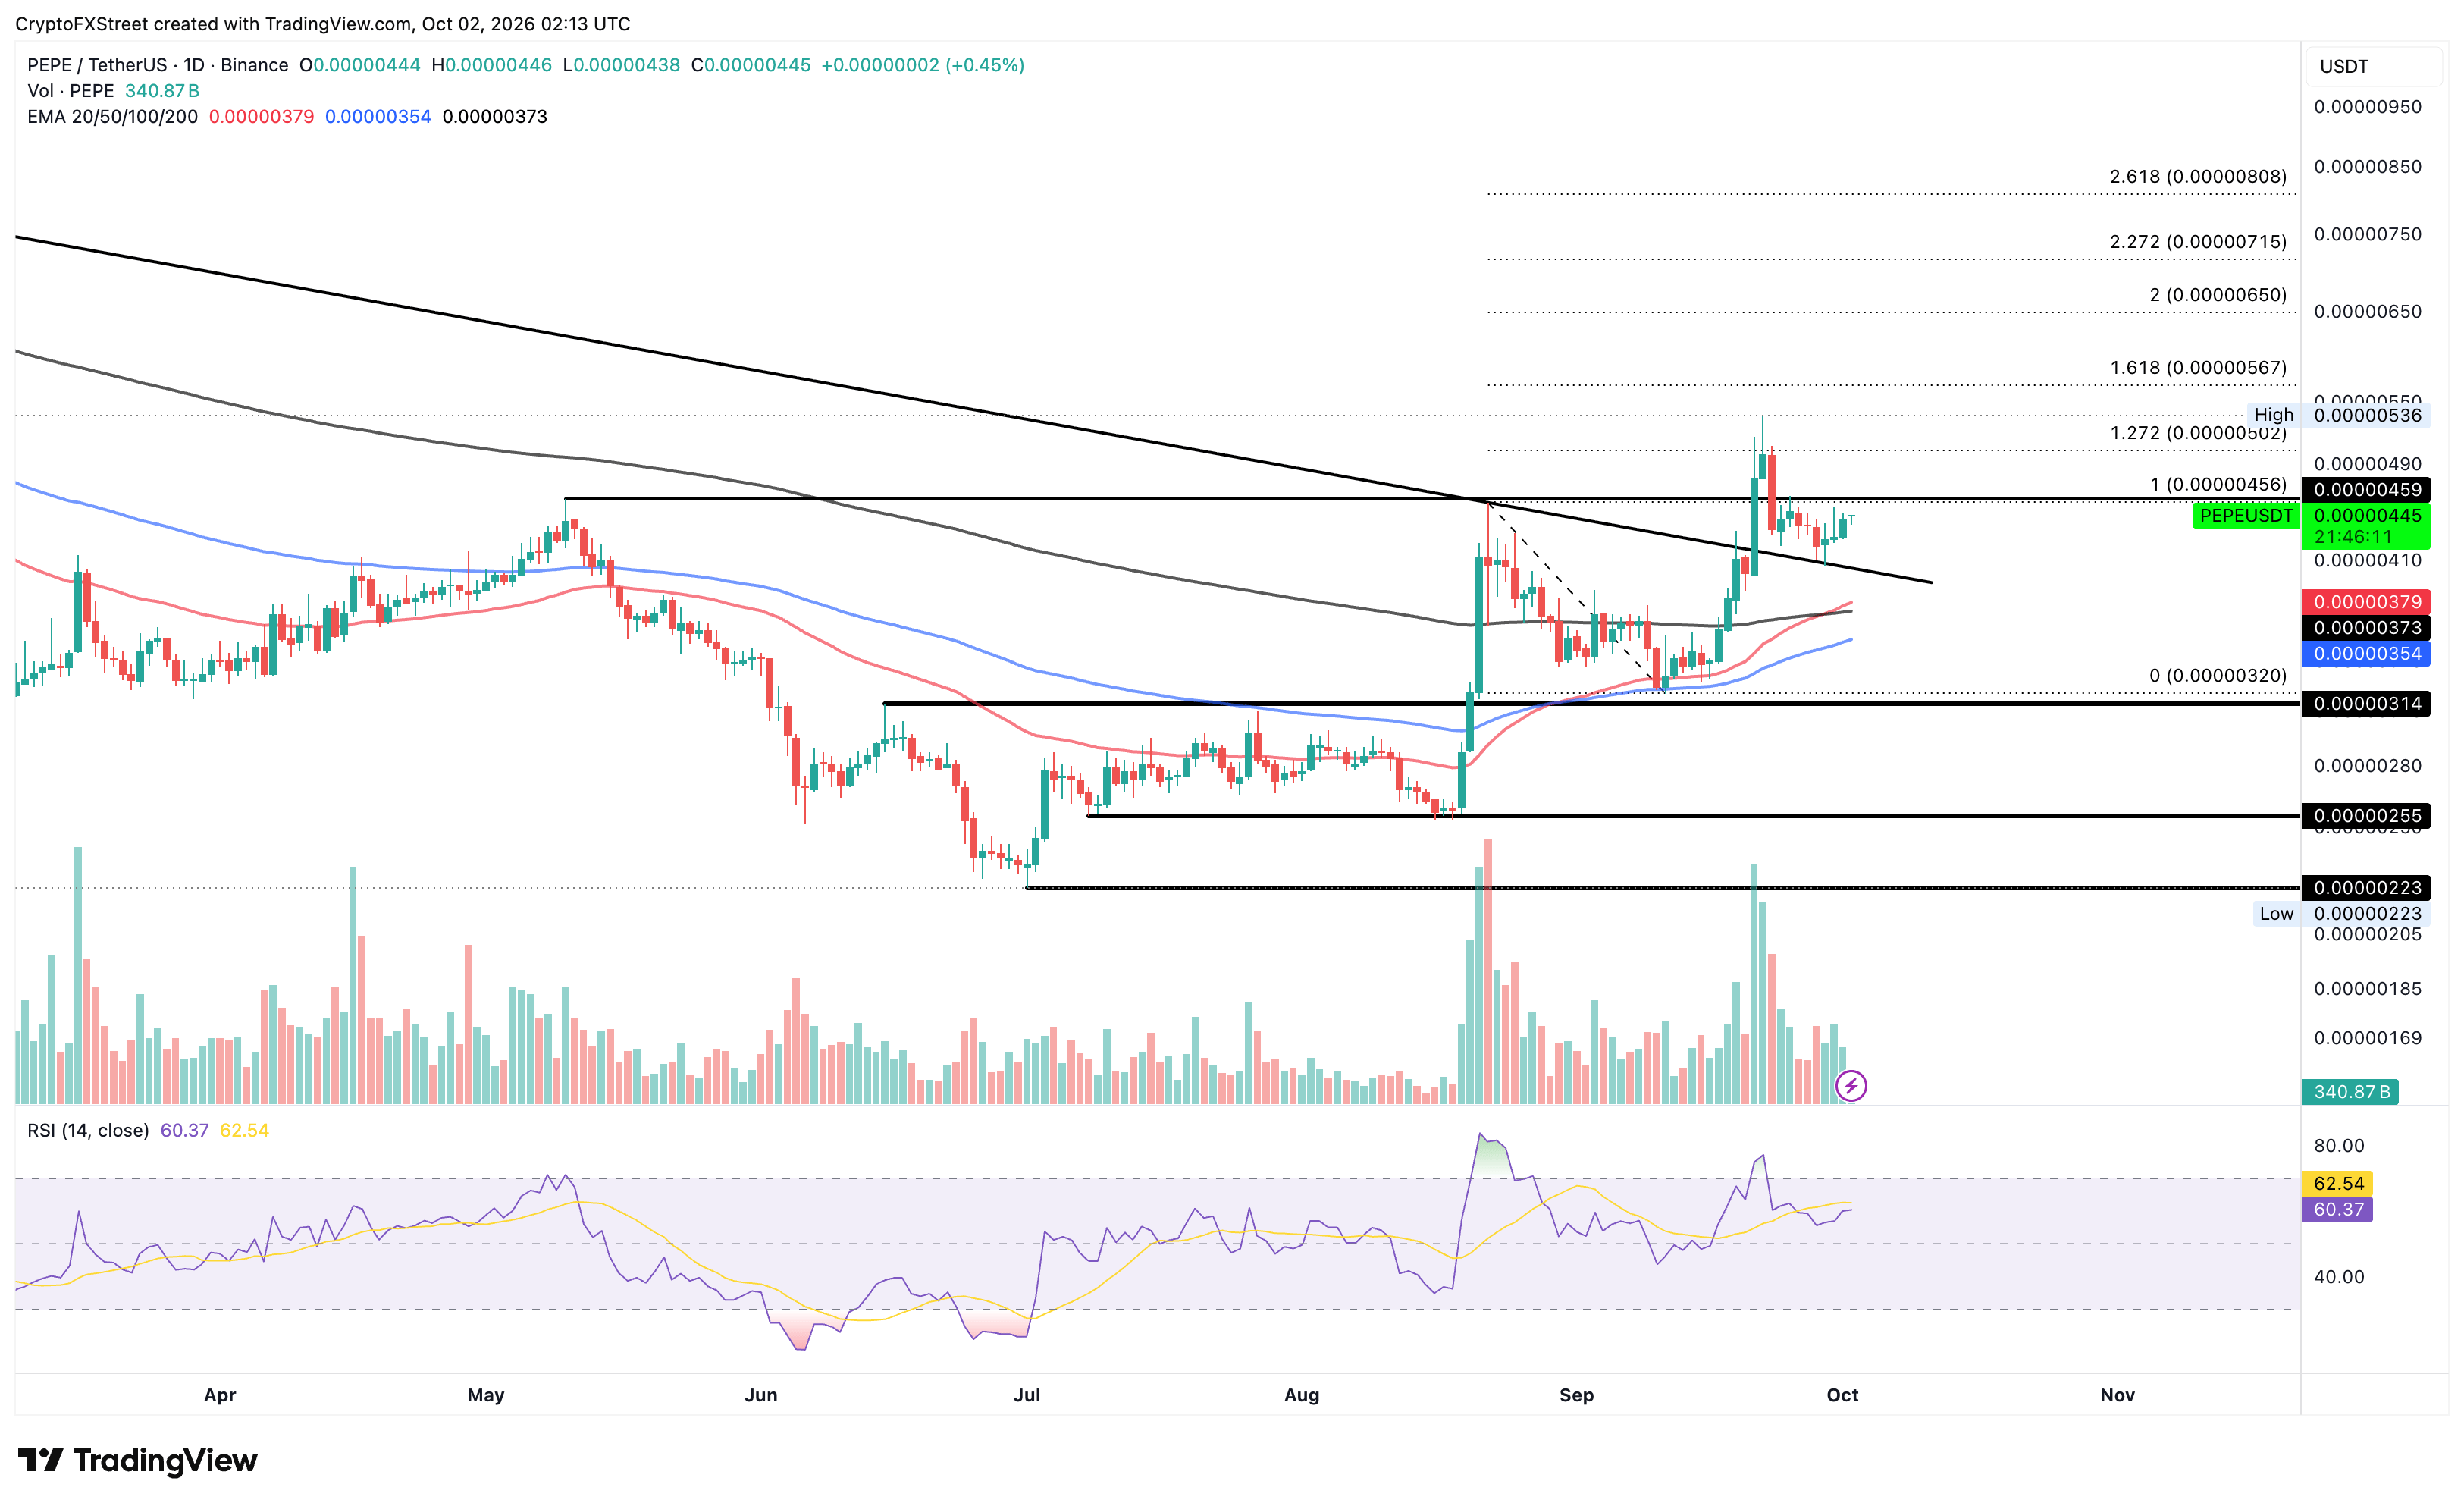
On the downside, initial support is seen at the $0.00000400 trendline break level, followed by the 50- and 200-day EMAs, which form a support cluster near $0.00000379 and $0.00000373.
(The technical analysis of this story was written with the help of an AI tool. Know more.)
인기 기사
1Gold struggles to lure buyers amid bullish USD; eye US NFP for Fed rate cues2Top 3 Price Prediction: Bitcoin, Ethereum, Ripple – BTC heading to $85,000, ETH awaits breakout, XRP holds $1.50 3Euro flattens against the Japanese Yen in countdown to Eurozone HICP data4Pepe Price Forecast: PEPE sustains mild recovery on firm retail support5Australian Dollar loses as US Dollar receives support from persistent inflation concerns6Euro weakens below 1.1250 on fiscal concerns, US NFP data looms7Japan’s Katayama says will beef up efforts to promote version of doge review of subsidies, funds8Silver Price Forecast: XAG/USD slips below $60.50 amid rising inflation concerns9United States Dollar Index sits near March 2025 highs, above 102.00 ahead of US NFP
실시간 시세


TECHNICAL에 대한 모든 것

소셜 미디어












이 웹사이트에 제공된 정보는 일반적인 성격의 정보일 뿐이며 개인 맞춤형 금융 자문을 구성하지 않습니다. 이 웹사이트의 정보를 바탕으로 행동하기 전에, 귀하의 목표, 재정 상황 및 필요에 비추어 해당 정보의 적합성을 고려해야 합니다. CFD 및 FX 마진 계약에 대한 투자는 상당한 위험을 수반하며 모든 투자자에게 적합하지 않을 수 있습니다. 귀하는 최초 예치금보다 더 큰 손실을 입을 수 있습니다. 귀하는 기초자산에 대한 소유권이나 어떠한 이해관계도 보유하지 않습니다. 거래를 시작하기 전에 독립적인 자문을 구하고 관련 위험을 충분히 이해하시기를 권장합니다. 웹사이트에 기재된 상품을 취득하기 전에 공시 문서를 읽고 검토하는 것이 중요합니다. 이 웹사이트에서 제공되는 정보 및 광고는 그러한 사용이 현지 법률 및 규정에 위배되는 국가 또는 관할권의 개인이 사용하도록 의도된 것이 아닙니다. 이 웹사이트에서 제공되는 상품 및 서비스는 미국, 말레이시아 및 태국 거주자를 대상으로 하지 않습니다.
TMGM은 다양한 관할권에서 승인 및 규제를 받고 있습니다.
TMGM으로 거래하는 Trademax Australia Limited는 호주 증권투자위원회(ASIC)의 규제를 받으며, AFSL 번호 436416이고 Level 28, One International Tower, 100 Barangaroo Avenue, 2000 Sydney, NSW Australia에 위치하고 있습니다.
이메일: [email protected]
TMGM으로 거래하는 Trademax Global Limited는 바누아투 금융서비스위원회(VFSC)의 승인 및 규제를 받으며, 등록 번호 40356이고 1276, Kumul Highway, Port Vila, Vanuatu, Republic of Vanuatu에 등록되어 있습니다.
이메일: [email protected]
Trademax Global Markets (SE) Limited(이하 TMGM)는 세이셸 금융청(FSA)의 인가 및 규제를 받으며, 허가 번호는 SD224입니다. 회사는 세이셸 마헤, 프로비던스 에스테이트 ABIS 센터, 사무실 번호 13에 등록되어 있습니다.
이메일: [email protected]
TMGM으로 거래하는 Trademax Global Markets (International) Pty Ltd는 모리셔스 금융서비스위원회(FSC)의 승인 및 규제를 받으며 라이선스 번호 GB22201012이고, 33, Edith Cavell Street C/o IQ EQ Fund Services (Mauritius) Ltd Port Louis, 11324 Mauritius에 등록되어 있습니다.
이메일: [email protected]
Copyright © TMGM. All rights reserved