


US Dollar Index Price Forecast: Hawkish Fed pricing backs more upside above 102.20
- The US Dollar Index edges lower to near 101.88; however, the outlook remains strong.
- Investors await the US NFP data for September releasing at 12:30 GMT.
- The Fed is expected hike interest rates further by 100 bps in one-year timeframe.
The US Dollar (USD) trades marginally lower on Friday ahead of the United States (US) Nonfarm Payrolls (NFP) data for September at 12:30 GMT. In the early European trade, the US Dollar Index (DXY), which gauges the Greenback’s value against six major currencies, trades marginally lower to near 101.88, but is still close to its over-a-year high of 102.20 posted on Thursday.

US Dollar Price This week
The table below shows the percentage change of US Dollar (USD) against listed major currencies this week. US Dollar was the strongest against the Euro.
| USD | EUR | GBP | JPY | CAD | AUD | NZD | CHF | |
|---|---|---|---|---|---|---|---|---|
| USD | 1.09% | 0.16% | 0.17% | 0.51% | 1.09% | 0.80% | -0.12% | |
| EUR | -1.09% | -1.00% | -0.83% | -0.60% | -0.01% | -0.30% | -1.21% | |
| GBP | -0.16% | 1.00% | -0.06% | 0.35% | 0.94% | 0.64% | -0.27% | |
| JPY | -0.17% | 0.83% | 0.06% | 0.22% | 0.83% | 0.52% | -0.41% | |
| CAD | -0.51% | 0.60% | -0.35% | -0.22% | 0.62% | 0.27% | -0.61% | |
| AUD | -1.09% | 0.00% | -0.94% | -0.83% | -0.62% | -0.30% | -1.21% | |
| NZD | -0.80% | 0.30% | -0.64% | -0.52% | -0.27% | 0.30% | -0.90% | |
| CHF | 0.12% | 1.21% | 0.27% | 0.41% | 0.61% | 1.21% | 0.90% |
The heat map shows percentage changes of major currencies against each other. The base currency is picked from the left column, while the quote currency is picked from the top row. For example, if you pick the US Dollar from the left column and move along the horizontal line to the Japanese Yen, the percentage change displayed in the box will represent USD (base)/JPY (quote).
The US NFP report is expected to show that the economy created 90K fresh jobs, lower than 162K in August, with the Unemployment Rate remaining steady at 4.1%. The data will likely have a significant impact on Federal Reserve’s (Fed) interest rate expectations.
Meanwhile, traders remaining increasingly confident that the Fed will deliver more interest rate hikes in the near term is providing strength to the US Dollar.
Strategists at Brown Brothers Harriman (BBH) note that "USD is up across the board, with the DXY index making new cyclical highs," underpinned by a resilient US backdrop. They point to "resilient US economic activity, improving labor demand, and sticky inflation" as key factors that "back the nearly 100bps of Fed funds rate hikes priced over the next twelve months," reinforcing the constructive tone toward the Dollar.
Higher hawkish Fed expectations have boosted US Treasury Yields. In the European trade on Friday, 10-year US Treasury Yields are flat at around 5.25% but are still close to its over two-decade high of 5.34% posted the previous day.
US Dollar Index Technical Analysis
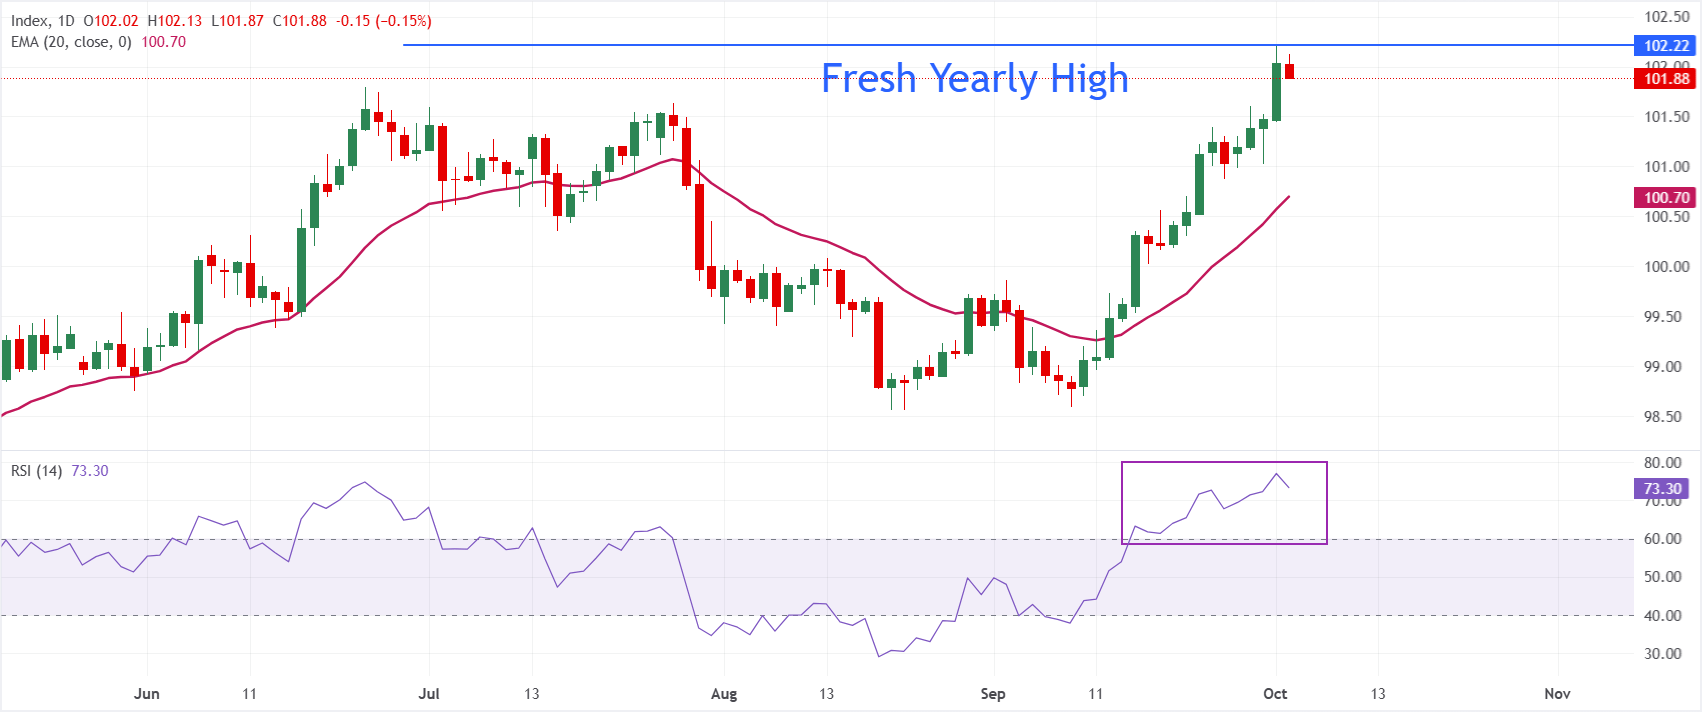
In the daily chart, Dollar Index Spot trades at 101.88. The index holds above the 20-day exponential moving average (EMA) at 100.70, which keeps the near-term bias bullish as price extends its advance away from this dynamic floor. The Relative Strength Index (14) at 73.18 sits in overbought territory, hinting that the latest breakout is stretched but not yet reversed.
On the downside, initial support is seen at the 20-day EMA at 100.70. Looking up, the fresh annual high at 102.20 is the immediate resistance; above that the 10 April 2025 high at 103.03 would be the key hurdle.
(The technical analysis of this story was written with the help of an AI tool. Know more.)
US Dollar FAQs
The US Dollar (USD) is the official currency of the United States of America, and the ‘de facto’ currency of a significant number of other countries where it is found in circulation alongside local notes. It is the most heavily traded currency in the world, accounting for over 88% of all global foreign exchange turnover, or an average of $6.6 trillion in transactions per day, according to data from 2022. Following the second world war, the USD took over from the British Pound as the world’s reserve currency. For most of its history, the US Dollar was backed by Gold, until the Bretton Woods Agreement in 1971 when the Gold Standard went away.
The most important single factor impacting on the value of the US Dollar is monetary policy, which is shaped by the Federal Reserve (Fed). The Fed has two mandates: to achieve price stability (control inflation) and foster full employment. Its primary tool to achieve these two goals is by adjusting interest rates. When prices are rising too quickly and inflation is above the Fed’s 2% target, the Fed will raise rates, which helps the USD value. When inflation falls below 2% or the Unemployment Rate is too high, the Fed may lower interest rates, which weighs on the Greenback.
In extreme situations, the Federal Reserve can also print more Dollars and enact quantitative easing (QE). QE is the process by which the Fed substantially increases the flow of credit in a stuck financial system. It is a non-standard policy measure used when credit has dried up because banks will not lend to each other (out of the fear of counterparty default). It is a last resort when simply lowering interest rates is unlikely to achieve the necessary result. It was the Fed’s weapon of choice to combat the credit crunch that occurred during the Great Financial Crisis in 2008. It involves the Fed printing more Dollars and using them to buy US government bonds predominantly from financial institutions. QE usually leads to a weaker US Dollar.
Quantitative tightening (QT) is the reverse process whereby the Federal Reserve stops buying bonds from financial institutions and does not reinvest the principal from the bonds it holds maturing in new purchases. It is usually positive for the US Dollar.
인기 기사
1Top Altcoins Price Forecast: Ripple, Cardano, Solana – Strong recovery signals breakout rally2Euro holds losses against British Pound amid French debt woes, high Oil Prices3US Dollar Index Price Forecast: Hawkish Fed pricing backs more upside above 102.204Japanese Yen rises due to hot Tokyo CPI, dovish Fed bets5New Zealand Dollar rebounds ahead of US jobs data, election uncertainty lingers6USD/CAD Price Forecast: Falls to near 1.4200 after pulling back from nearly 18-month highs7Silver price forecast: XAG/USD rises to near $61.40 as US yields retreat, NFP eyed8Cardano Price Forecast: ADA bulls gain traction on Japan adoption deal9WTI Price Forecast: Dips to $91.50 as Middle East jitters limit losses



소셜 미디어












이 웹사이트에 제공된 정보는 일반적인 성격의 정보일 뿐이며 개인 맞춤형 금융 자문을 구성하지 않습니다. 이 웹사이트의 정보를 바탕으로 행동하기 전에, 귀하의 목표, 재정 상황 및 필요에 비추어 해당 정보의 적합성을 고려해야 합니다. CFD 및 FX 마진 계약에 대한 투자는 상당한 위험을 수반하며 모든 투자자에게 적합하지 않을 수 있습니다. 귀하는 최초 예치금보다 더 큰 손실을 입을 수 있습니다. 귀하는 기초자산에 대한 소유권이나 어떠한 이해관계도 보유하지 않습니다. 거래를 시작하기 전에 독립적인 자문을 구하고 관련 위험을 충분히 이해하시기를 권장합니다. 웹사이트에 기재된 상품을 취득하기 전에 공시 문서를 읽고 검토하는 것이 중요합니다. 이 웹사이트에서 제공되는 정보 및 광고는 그러한 사용이 현지 법률 및 규정에 위배되는 국가 또는 관할권의 개인이 사용하도록 의도된 것이 아닙니다. 이 웹사이트에서 제공되는 상품 및 서비스는 미국, 말레이시아 및 태국 거주자를 대상으로 하지 않습니다.
TMGM은 다양한 관할권에서 승인 및 규제를 받고 있습니다.
TMGM으로 거래하는 Trademax Australia Limited는 호주 증권투자위원회(ASIC)의 규제를 받으며, AFSL 번호 436416이고 Level 28, One International Tower, 100 Barangaroo Avenue, 2000 Sydney, NSW Australia에 위치하고 있습니다.
이메일: [email protected]
TMGM으로 거래하는 Trademax Global Limited는 바누아투 금융서비스위원회(VFSC)의 승인 및 규제를 받으며, 등록 번호 40356이고 1276, Kumul Highway, Port Vila, Vanuatu, Republic of Vanuatu에 등록되어 있습니다.
이메일: [email protected]
Trademax Global Markets (SE) Limited(이하 TMGM)는 세이셸 금융청(FSA)의 인가 및 규제를 받으며, 허가 번호는 SD224입니다. 회사는 세이셸 마헤, 프로비던스 에스테이트 ABIS 센터, 사무실 번호 13에 등록되어 있습니다.
이메일: [email protected]
TMGM으로 거래하는 Trademax Global Markets (International) Pty Ltd는 모리셔스 금융서비스위원회(FSC)의 승인 및 규제를 받으며 라이선스 번호 GB22201012이고, 33, Edith Cavell Street C/o IQ EQ Fund Services (Mauritius) Ltd Port Louis, 11324 Mauritius에 등록되어 있습니다.
이메일: [email protected]
Copyright © TMGM. All rights reserved