




Shiba Inu Price Forecast: SHIB risks over 10% drawdown amid declining burn rate
- Shiba Inu extends losses for a third consecutive day on Friday, testing the breakdown below the 50-day EMA at $0.00000466.
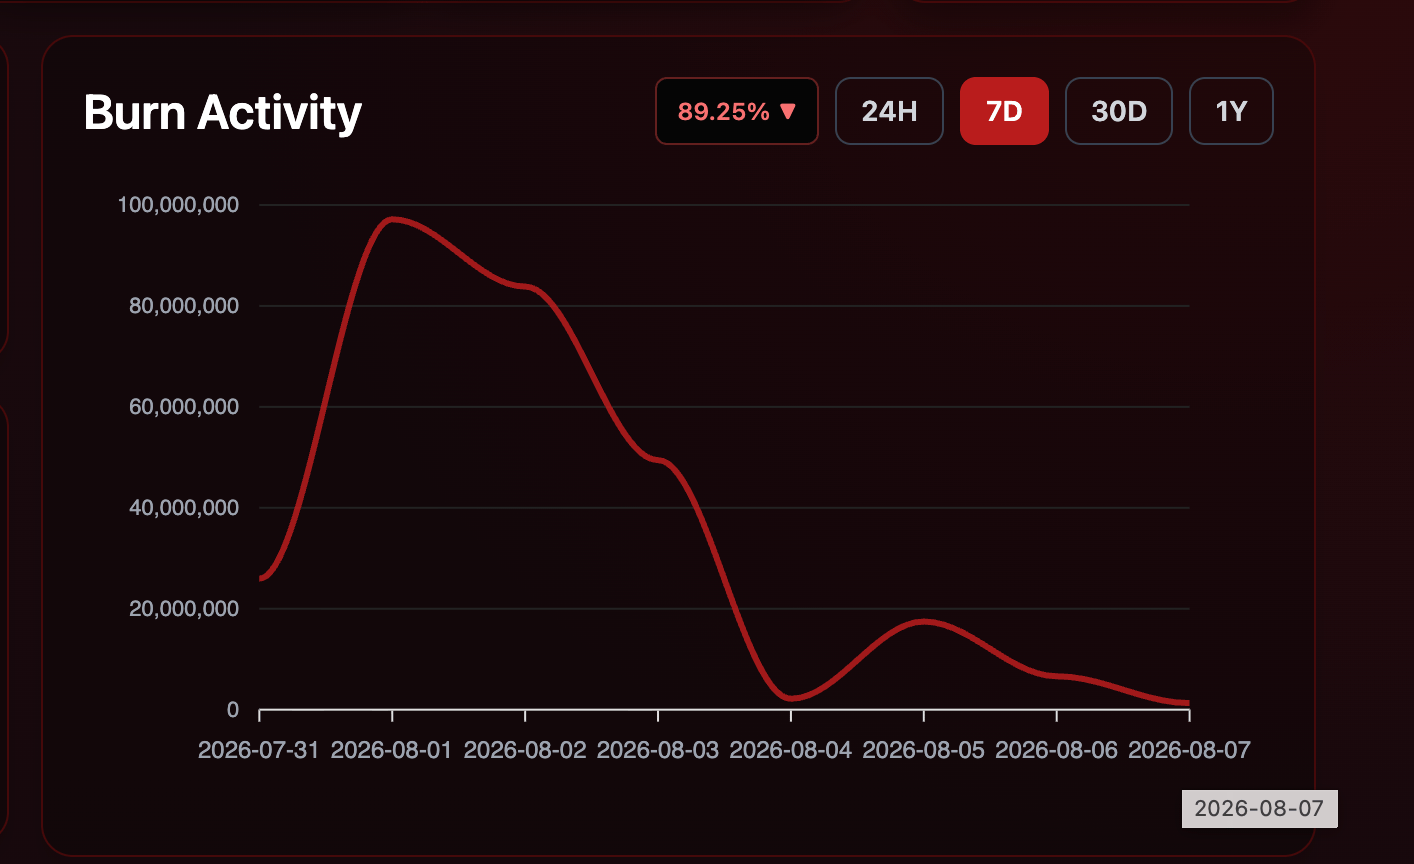
- Over 6.62 million SHIB tokens were burned on Thursday, down from 97.16 million on Saturday, pointing to a declining burn rate.
- Retail activity shows mixed sentiment, with funding rates fluctuating amid heightened liquidations of long positions.
Shiba Inu (SHIB) edges lower on Friday, facing downside pressure amid broader risk-off sentiment in the cryptocurrency market, including a delay in the CLARITY Act vote. The declining burn rate of SHIB tokens and retail support warn of deeper losses in the meme coin. The technical outlook for SHIB is bearish as the price tests the 50-day Exponential Moving Average (EMA) breakout level at $0.00000466.

Declining burn rate weighs on Shiba Inu
Shiba Inu burned over 97 million tokens on Saturday, aligning with the recent rebound earlier this week. However, a steady decline in SHIB token burn down to 6.62 million on Thursday reflects reducing supply pressure, which could weigh on the meme coin.
Retail support wanes amid delayed CLARITY Act vote
The delay in the CLARITY Act vote has reduced broader crypto risk appetite. Typically, meme coins are the first to flip bearish under broader market risk-averse conditions.
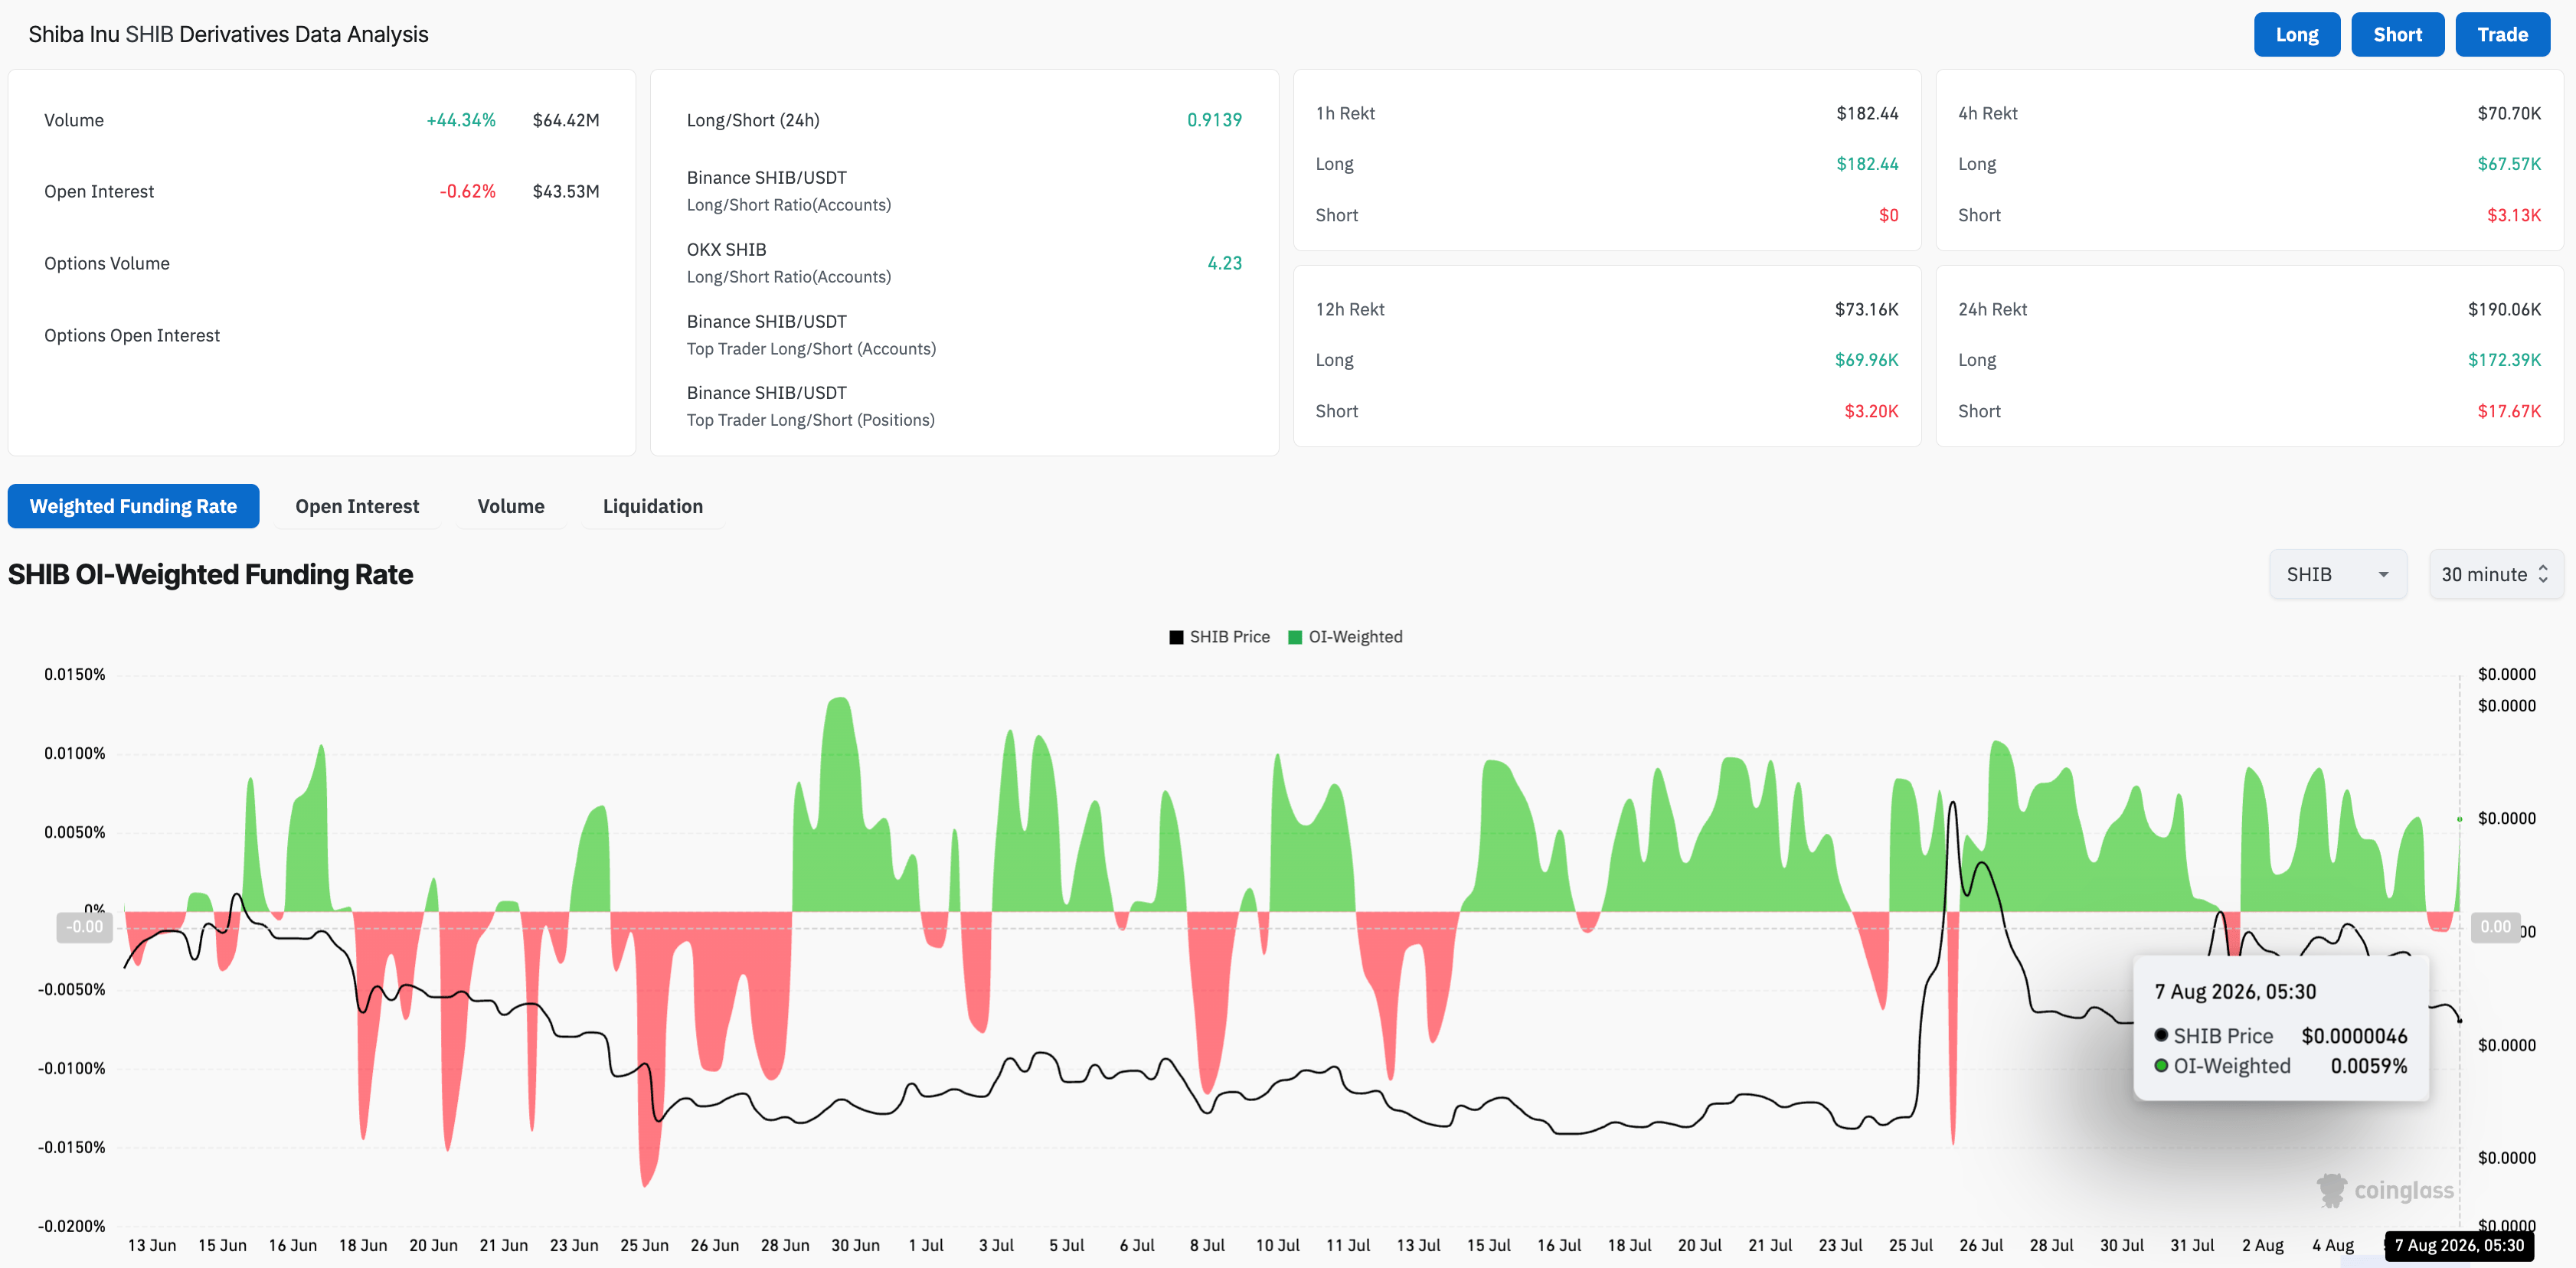
CoinGlass data shows that SHIB futures Open Interest (OI) has held firm near $43.53 million over the last 24 hours, while long liquidations of $172,390 have outpaced short liquidations of $17,670, reflecting bullish weakness. In addition, the funding rate bounced to 0.0059% on Friday, up from -0.0013% the previous day, reflecting fluctuating retail sentiment.
Technical outlook: Will SHIB extend its decline?
Shiba Inu extends losses on Friday, after a nearly 5% loss the previous day. The pullback tests the bearish breakout of the 50-day EMA at $0.0000046.
From a technical perspective, the short-term moving average is supported by the 78.6% Fibonacci retracement level, measured from the $0.00000670 high to the $0.00000405 low, at $0.00000462. A decisive close below this support cluster could extend the decline toward the Fibonacci anchor at $0.00000405, marking more than 10% downside risk from the current market price.
The Relative Strength Index (RSI) is at 49 on the daily chart, crossing below the midline as buying pressure wanes.
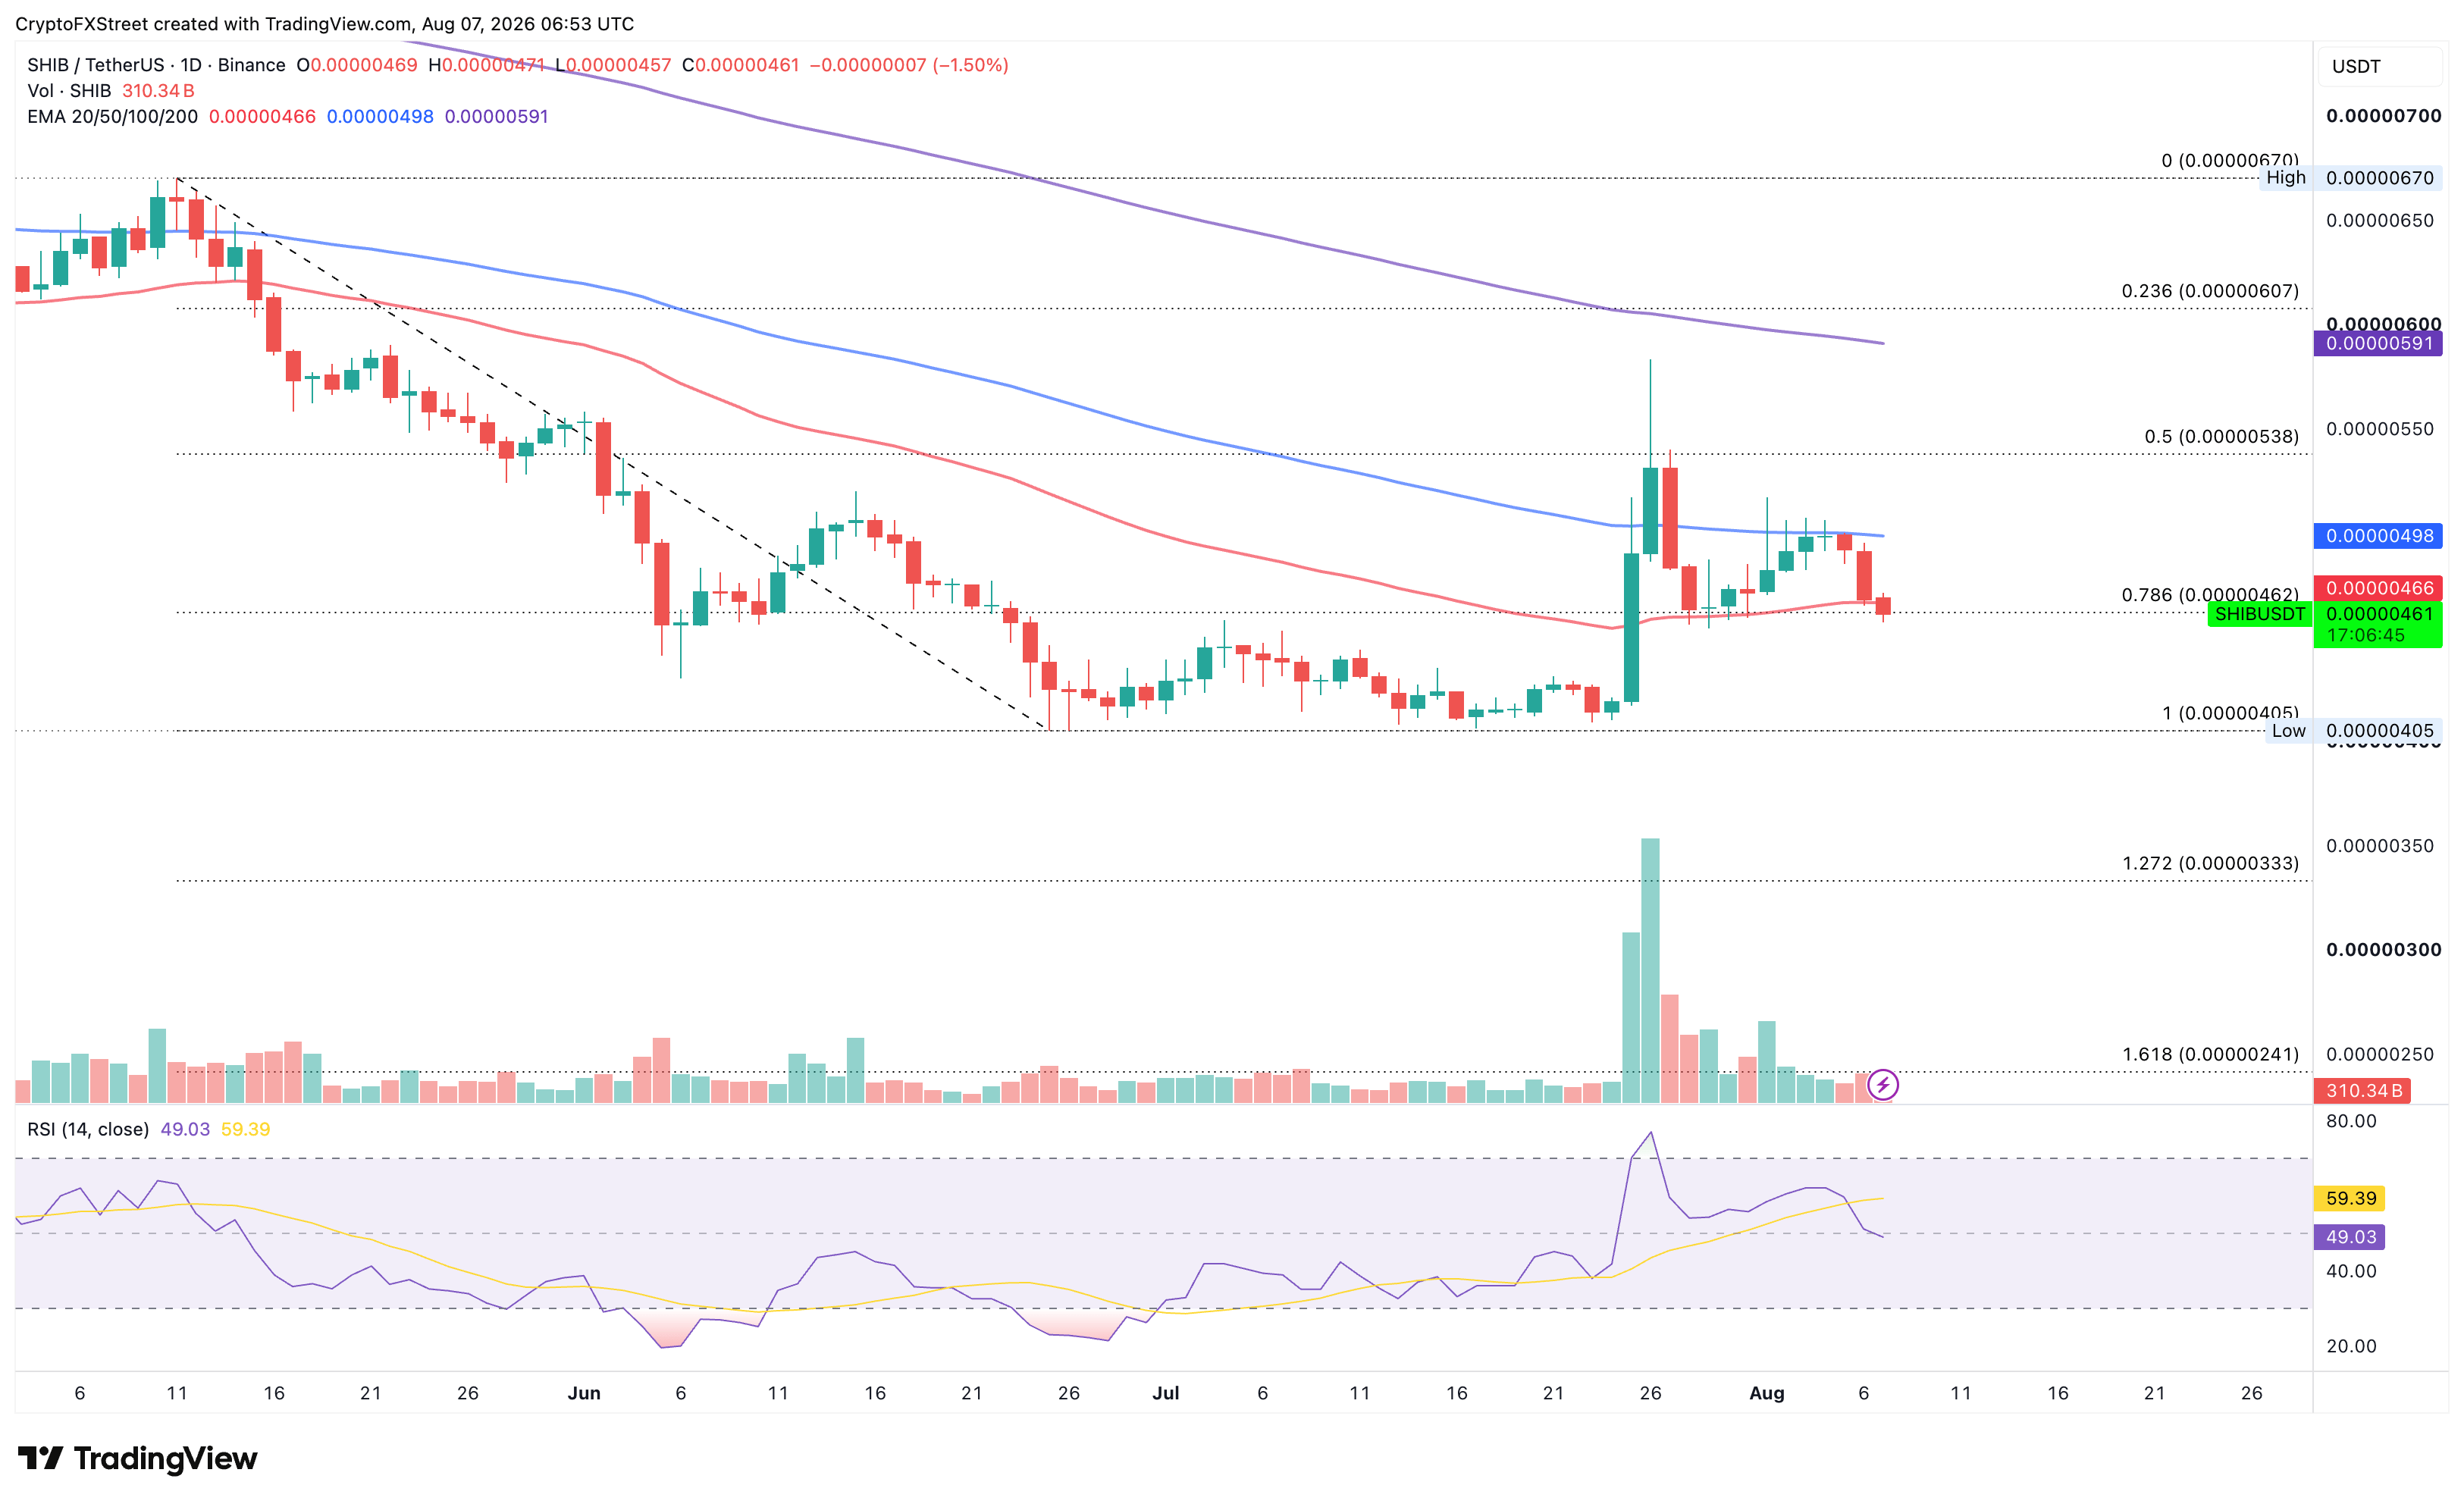
On the top side, a potential rebound from the 50-day EMA at $0.0000046 could target the 100-day EMA at $0.00000498, followed by the 50% retracement at $0.00000538.
(The technical analysis of this story was written with the help of an AI tool. Know more.)













