

USD/IDR Price Forecast: Trades near 17,850 after pulling back from moving averages
- USD/IDR may fall toward the lower rectangle boundary around 17,750.
- The 14-day Relative Strength Index at 43.48 signals fading bullish momentum.
- The pair may rebound toward the immediate barrier at the 50-day EMA of 17,896.
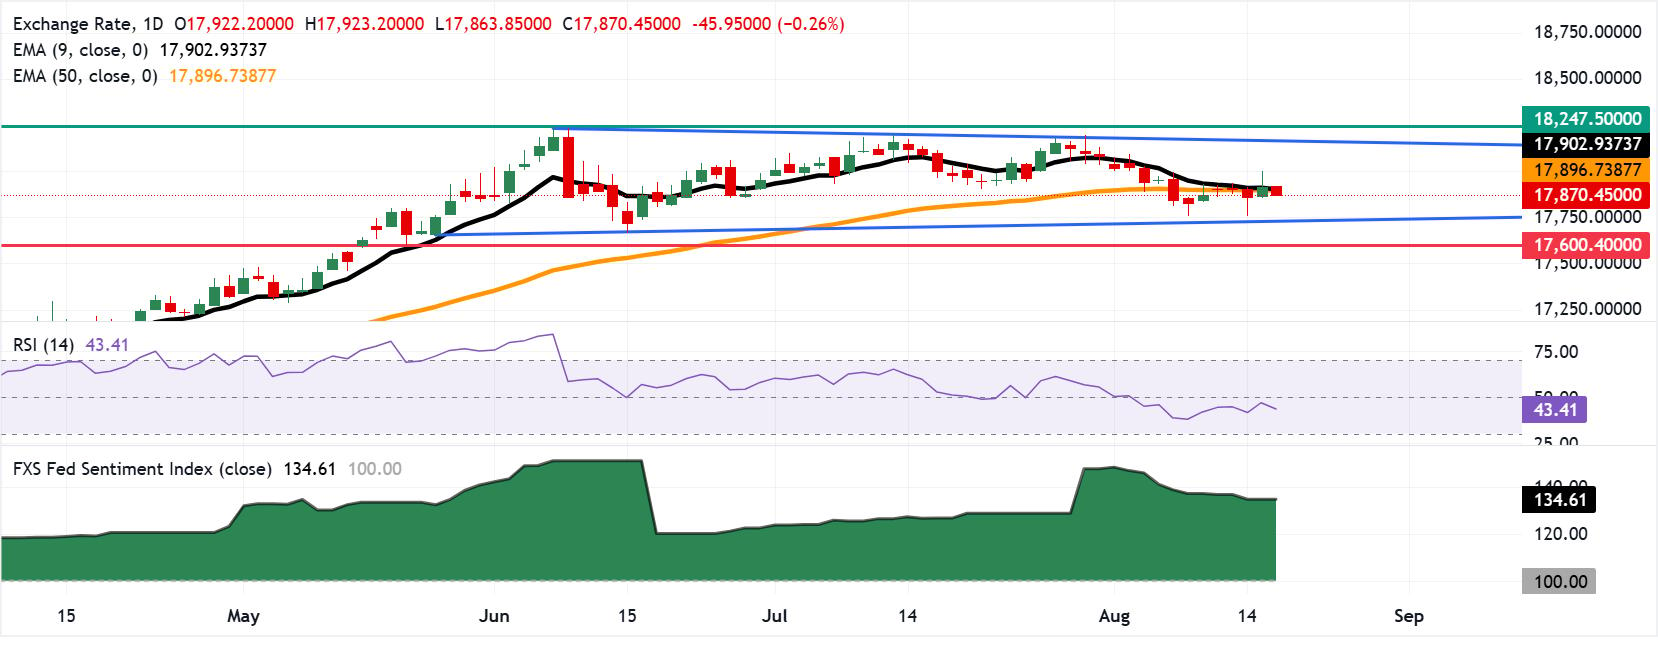
USD/IDR depreciates after registering modest gains in the previous day, trading around 17,870 during the Asian hours on Wednesday. The technical analysis of the daily chart suggests that the pair is remaining within the rectangle, indicating a consolidation phase.
The USD/IDR pair is holding a bearish near-term bias as spot remains capped beneath both the nine-period and 50-period Exponential Moving Averages (EMAs). The clustering of these short- and medium-term EMAs just above price suggests topside attempts are vulnerable, while the 14-day Relative Strength Index (RSI) at 43.48 points to fading bullish momentum without yet reaching oversold territory, keeping the pair under mild downside pressure.

The USD/IDR pair may fall toward the lower boundary of the rectangle around 17,750, followed by the three-month low of 17,600, which was recorded on May 20.
USD gains as risk aversion weighs on Asia FX
Strategists at UOB Group highlight that renewed caution in global markets has reinforced demand for the Dollar, noting that the "USD firmed up against most Asia FX as risk aversion returned as the key near-term driver." They point out that the shift in sentiment has left regional currencies on the back foot, with investors gravitating toward the relative safety of the Greenback as risk appetite fades.
On the upside, the immediate barrier lies at the 50-day EMA of 17,896, followed by the nine-day EMA at 17,902. A break above these moving averages would reinforce the bullish bias and support the USD/IDR pair to approach the upper boundary of the rectangle around 18,170, followed by the all-time high of 18,247, reached on June 8.
Goolsbee’s cautious optimism on inflation keeps Dollar focus on Fed path
Fed’s Goolsbee delivered a notably softer tone, with an FXS Speechtracker score of 4.6/10, well below the 6.8/10 historical average, signaling reduced hawkish conviction. The emphasis on “a little bit better” inflation readings and hope that tariff- and oil-driven price spikes prove one-off suggests growing confidence that inflation can drift back toward 2%, but without declaring victory. The characterization of the US economy as “steady” reinforces a gradualist stance, implying the Fed can stay patient while watching incoming data.
The FXS Fed Sentiment Index fell 2.36 points to 134.61, indicating a modest pullback in perceived hawkishness. Despite the decline, the index remains firmly above the 100 neutral mark, underscoring that Fed policy is still viewed as hawkish overall, even as Goolsbee’s softer tone drags the FXS Speechtracker score below the established baseline.
(The technical analysis of this story was written with the help of an AI tool. Know more.)
US Dollar FAQs
The US Dollar (USD) is the official currency of the United States of America, and the ‘de facto’ currency of a significant number of other countries where it is found in circulation alongside local notes. It is the most heavily traded currency in the world, accounting for over 88% of all global foreign exchange turnover, or an average of $6.6 trillion in transactions per day, according to data from 2022. Following the second world war, the USD took over from the British Pound as the world’s reserve currency. For most of its history, the US Dollar was backed by Gold, until the Bretton Woods Agreement in 1971 when the Gold Standard went away.
The most important single factor impacting on the value of the US Dollar is monetary policy, which is shaped by the Federal Reserve (Fed). The Fed has two mandates: to achieve price stability (control inflation) and foster full employment. Its primary tool to achieve these two goals is by adjusting interest rates. When prices are rising too quickly and inflation is above the Fed’s 2% target, the Fed will raise rates, which helps the USD value. When inflation falls below 2% or the Unemployment Rate is too high, the Fed may lower interest rates, which weighs on the Greenback.
In extreme situations, the Federal Reserve can also print more Dollars and enact quantitative easing (QE). QE is the process by which the Fed substantially increases the flow of credit in a stuck financial system. It is a non-standard policy measure used when credit has dried up because banks will not lend to each other (out of the fear of counterparty default). It is a last resort when simply lowering interest rates is unlikely to achieve the necessary result. It was the Fed’s weapon of choice to combat the credit crunch that occurred during the Great Financial Crisis in 2008. It involves the Fed printing more Dollars and using them to buy US government bonds predominantly from financial institutions. QE usually leads to a weaker US Dollar.
Quantitative tightening (QT) is the reverse process whereby the Federal Reserve stops buying bonds from financial institutions and does not reinvest the principal from the bonds it holds maturing in new purchases. It is usually positive for the US Dollar.













