

Trading
Explore a wide range of markets with competitive pricing, deep liquidity, and advanced trading tools.
Learn More 
Platform
Trade seamlessly with TMGM's powerful platform, built for speed, precision, and a superior trading experience.
Learn More Trading Platform
Academy
Learn the fundamentals of trading with beginner-friendly resources, including guides, webinars, and market insights.
Learn More News & Analysis
Get real-time market updates and expert analysis to stay ahead of trading opportunities
Learn More News & Analysis
About
Learn what sets TMGM apart — our global presence, regulatory strength, and commitment to innovation in trading.
Learn More Why Choose TMGM
Sponsorship
Gold at $4,100: 3 forecasts weigh a bullish Arc rejection, a bearish Fed setup and a festival tiebreaker
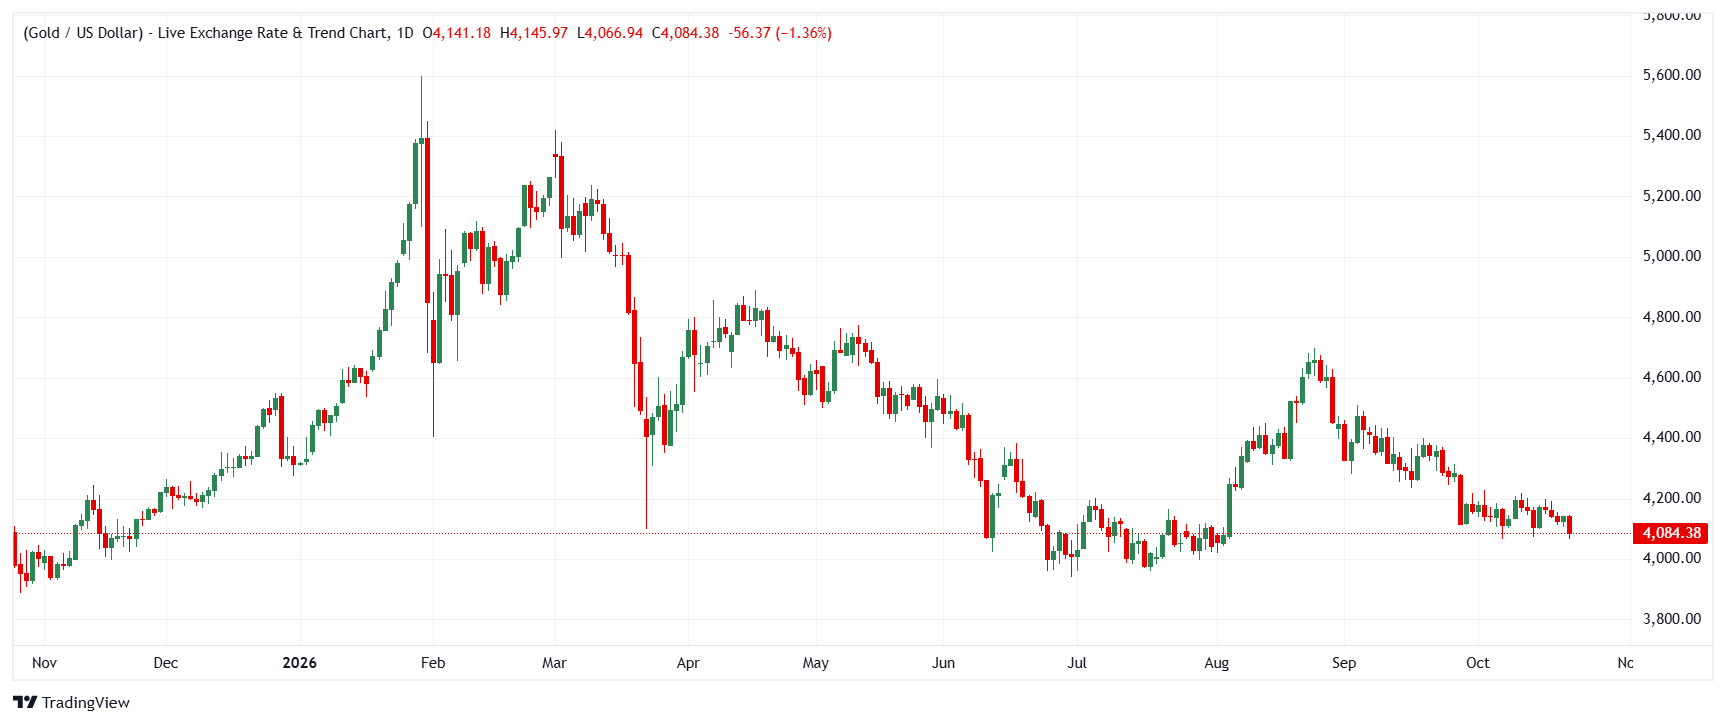
Gold (XAU/USD) faces conflicting signals near $4,100, with the three latest analyses offering different readings of the level. A rebound from support suggests a possible advance towards $4,227 in one assessment; another sees rallies as vulnerable for as long as price remains below its 20-day EMA. The third turns to India's Diwali buying season, where physical demand is about to put the market to the test.
Independent Analyst Mohamad Gharib: Can the Support Arc sustain Gold’s rebound?

A failed break below the 1 (100%) Support Arc in the current cycle underpins Gharib’s bullish view, based on Arc Cycle Analysis of Gold’s 4h chart. In his assessment, "The rebound confirms a bullish reaction and opens the potential for continued movement higher, toward 4,227," although he sets a clear condition: "a sustained 4h close below 4,105 would invalidate the bullish scenario and could reopen the path toward the next Support Arc." That threshold is already under scrutiny, with the spot price cited by the other analysts having fallen to $4,095. — Access the complete analysis
FXStreet’s Sagar Dua: Will oil and inflation fears keep the Fed on hold?
Monetary policy anchors the bearish view from Dua, who reports: "Gold is down 1% to near $4,095 in the Asian trading session on Thursday on the back of fears that global inflation expectations could accelerate further due to heightened geopolitical tensions in the Middle East." Rising inflationary pressures, he argues, steer central banks towards tighter monetary policy, which "bodes poorly for non-yielding assets, such as Gold,". The Fed is expected to leave rates within the 3.75%-4.00% range next Wednesday; its guidance, rather than necessarily the rate decision, is the main potential catalyst. On the technical front, the RSI is near 40 in negative territory and XAU/USD remains beneath its 20-day EMA of roughly $4,172. Easing the downward bias requires a daily close above that EMA. — Access the complete analysis
Citadel Gold’s Shaun Bina: Can Diwali demand break the deadlock?
Physical demand takes centre stage in Bina’s assessment. WGC figures show that India represented 27% of global jewellery demand and 16% of global bar and coin demand in the second quarter. That makes the festive season significant: "festival buying is a visible input to the physical market behind XAU/USD", with Dhanteras falling on 6 November and Diwali on 8 November. Several constraints mark the start of the 2026 season: a 15% import duty imposed in mid-May, the largest increase on record; a weaker rupee; and a shift in demand from jewellery towards bullion. Bar and coin purchases in the first half totalled about 113 tonnes, a 13-year high. There is already an encouraging sign of price-sensitive buying. Citing Reuters, the report notes that dealers shifted from discounts of up to $6 an ounce to premiums of up to $7 in mid-October as lower prices encouraged purchases. This was the first premium in more than three months. Through the festival period, Bina is tracking whether that premium survives after Diwali, alongside October import figures and the rupee’s influence. — Access the complete analysis
Which signal will settle Gold’s direction?
With price below both key thresholds, a single level could determine the market’s next verdict. For Gharib’s bullish Arc scenario to remain valid, Gold needs a sustained 4h close back above $4,105; Dua’s bearish reading depends on the $4,172 EMA continuing to cap rallies. Beyond those chart signals, Bina introduces Indian festive demand as a third factor that technical analysis cannot price in, with the physical premium having turned positive for the first time in more than three months. The sequence to monitor starts with the 4h close at $4,105, followed by the Fed’s guidance on Wednesday and, finally, the premium after Diwali. Physical market strength during the festive season could provide the deciding signal that technical indicators rarely anticipate.
(This article was created with the help of an Artificial Intelligence tool and reviewed by an editor. Know more.)
POPULAR ARTICLES
1Gold falls below $4,100: How is the Middle East energy shock reinforcing the hawkish Fed outlook?2Crypto Today: Why are Bitcoin, Ethereum and XRP falling despite net ETF inflows?3Gold Price Forecast: Can XAU/USD hold key support at $4,070 as high oil prices test the level?4British Pound: Why Does Sterling’s High-Carry Profile Support It Against the Euro? – ING5Indian Rupee: How are trade hopes lifting INR against the US Dollar? - Societe Generale6Bitcoin Price Forecast: Is geopolitical uncertainty pushing BTC lower despite ETF inflows?7Swiss Franc: Gains Against US Dollar Edge Gradually Towards 0.8200 – UOB8Gold at $4,100: 3 forecasts weigh a bullish Arc rejection, a bearish Fed setup and a festival tiebreaker9Turkish Lira: Depreciation risks rise as rates are cut - Commerzbank
LIVE QUOTES


ALL ABOUT OIL
5 Best Oil Trading Platforms 2026 (Brent and WTI)
Iran War and the Global Economy in 2026: Oil, Inflation, Trade and Markets
Should You Still Invest in Oil in 2026?
WTI vs Brent Crude
Gold to Oil Ratio: How does the Iran War affect Gold Prices?
Top 10 Most Traded Commodities in India & The Best Commodity to Trade
What is WTI Oil: Importance, Purpose, How To Trade
Trading Brent Crude Oil: A Comprehensive Guide
How to Trade Oil in India: Steps, Markets and Risks
Get Started!
Sign up and access the Global Markets in less than 3 minutes

Connect With Us












The information provided on this website is of a general nature only and does not constitute personal financial advice. Before acting on any information on this website, you should consider the suitability of the information in relation to your objectives, financial situation and needs. Investing in CFDs and FX Margin Contracts carries significant risks and is not suitable for all investors. You may lose more than your initial deposit. You do not own, or have, any interest in the underlying asset. We recommend that you seek independent advice and ensure you fully understand the risks involved before trading. It is important that you read and consider the disclosure document before you acquire any product listed on the website. The information and advertisements offered on this website are not intended for use by any person in any country or jurisdiction where such use would be contrary to local laws and regulations. The Products and Services offered on this website are not intended for residents of the United States, Malaysia and Thailand.
TMGM is authorized and regulated in various jurisdictions.
Trademax Australia Limited, trading as TMGM, is regulated by the Australian Securities and Investments Commission (ASIC), AFSL no. 436416 and is located at Level 28, One International Tower, 100 Barangaroo Avenue, 2000 Sydney, NSW Australia.
Email: [email protected]
Trademax Global Limited, trading as TMGM, is authorized and regulated by the Vanuatu Financial Services Commission (VFSC), registration number 40356 and registered at 1276, Kumul Highway, Port Vila, Vanuatu, Republic of Vanuatu.
Email: [email protected]
Trademax Global Markets (SE) Limited, trading as TMGM, is authorized and regulated by the Financial Services Authority (FSA) of Seychelles, with license number SD224. The company is registered at Office No 13, Providence Estate ABIS Centre, Mahe, Seychelles.
Email: [email protected]
Trademax Global Markets (International) Pty Ltd, trading as TMGM, is authorized and regulated by the Financial Services Commission, Mauritius (FSC) with license no. GB22201012, and registered at 33, Edith Cavell Street C/o IQ EQ Fund Services (Mauritius) Ltd Port Louis, 11324 Mauritius.
Email: [email protected]
Copyright © TMGM. All rights reserved